
Artificial Intelligence
Mar 28, 2026
Evidence Sources & Methodology
Read more


Development and Validation of an Accessible Tiered Biological Age Model for Population Health


First Author: Serene TOH, BSc. — Global Lead Data Science and Modeling, Elfie Inc.
Corresponding Author: Jean-Francois LEGOURD, MSc. — Chief Product Officer, Elfie Inc.
Affiliations:
Elfie Inc., Global Health Data Science Division
Current biological age models often fail to convey risk in ways that are interpretable and actionable for the general population. A holistic measure that integrates lifestyle, physiological, and biomarker factors is needed to motivate prevention. Using NHANES linked mortality data, we developed and validated an interpretable “Biological Age” metric derived from behavioral, anthropometric, and biomarker data, scalable across settings with varying data availability.
We analyzed NHANES 2005–2009 with linkage to mortality through 2019 (Centers for Disease Control and Prevention [CDC], 2025). Adults aged ≥20 years with complete data on behavioral, physiological, and biochemical risk factors were included. Survey-weighted Cox proportional hazards models estimated associations with non-accidental mortality, accounting for the complex sampling design (Cox, 1972; Lumley, 2004; Therneau & Grambsch, 2000). Nonlinear associations were assessed with natural cubic splines(Wood, 2017); final models retained linear forms for most variables. Both the simplified and full models demonstrated strong discrimination and calibration when validated in NHANES 2010–2011.
The full model included blood sugar (HbA1c), eGFR, blood pressure, smoking, sleep hours, total metabolic expenditure per week, heart disease history, sex and age (analytic sample: 7,775 adults; 1,106 deaths). Blood sugar, average sleeping hours, smoking, and age were significant predictors; LDL cholesterol showed no independent association. To address biomarker missingness, we also estimated a simplified model comprising only age, sex, smoking, average sleeping hours, total metabolic expenditure per week, and heart disease history (n = 14,387; 2,164 deaths). Discrimination remained strong. Both models were externally validated with NHANES 2010–2011: the full model achieved concordance 0.870, calibration slope ~1.03; the simplified model achieved concordance 0.858, slope ~1.03. Biological Age strongly predicted mortality (HR per year ≈1.09–1.11).
A Biological Age metric can be derived either from a biomarker-rich model or a minimal model using only readily available variables. External validation confirms generalizability. The two-tier framework balances precision and feasibility, supporting use in population health, patient counseling, or public health surveillance.
Chronological age is a cornerstone metric in epidemiology and clinical practice, yet it fails to fully capture heterogeneity in biological risk. Two 60-year-olds may have vastly different trajectories of morbidity and mortality depending on lifestyles, comorbidities, and underlying biology. The concept of “biological age” aims to capture this divergence by aggregating multiple risk factors into a single metric that more closely reflects the individual’s physiological state (Klemera & Doubal, 2006; Levine, 2013; Liu et al., 2018).
Many existing models of biological age—such as epigenetic clocks, frailty indices, composite biomarker indices—require extensive biomarker panels or yield outputs that are abstract risk scores rather than intuitive estimates of “age”(Levine, 2013; Liu et al., 2018). For public health and clinical communication, interpretability and scalability are crucial (Ganna & Ingelsson, 2015).
We propose a two-tier Biological Age framework: a full model that incorporates biomarker measures when available, and a simplified model that relies only on easily obtained variables (age, sex, BMI, medical history and lifestyle variables such as average sleeping hours, physical activities, smoking and alcohol consumption). Using NHANES 2005–2009 with linked long-term mortality outcomes (CDC, 2025), we developed both models, derived a Biological Age metric by scaling Cox regression coefficients relative to the age coefficient (Klemera & Doubal, 2006), and then validated both in a separate NHANES 2010–2011 cohort. Our goal: to produce a robust, interpretable, and generalizable Biological Age measure suitable for broad use.
We analyzed data from the National Health and Nutrition Examination Survey, a nationally representative survey of the U.S. civilian, non-institutionalized population conducted by the National Center for Health Statistics (NCHS), Centers for Disease Control and Prevention (CDC, 2025). NHANES collected information through structured interviews, physical examinations, and laboratory testing performed in mobile examination centers, with detailed protocols published elsewhere [CDC, 2025; https://www.cdc.gov/nchs/nhanes/index.htm].
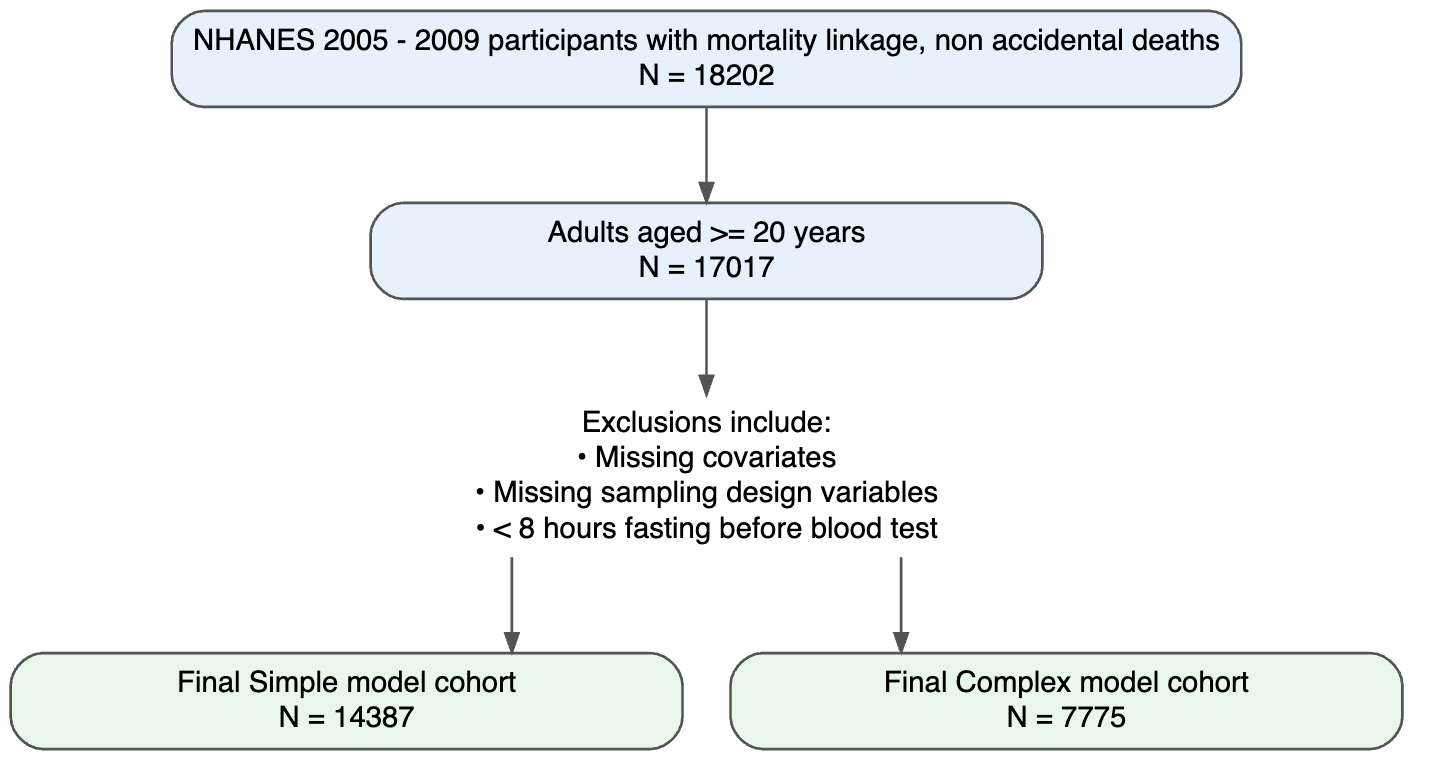
After exclusions, in NHANES 2005–2009 the full model analytic sample included 7,775 adults (1,106 deaths), and the simplified model had 14,387 adults (2,164 deaths). In the validation cohort, sample sizes were smaller.
All NHANES protocols were approved by the NCHS Research Ethics Review Board, and written informed consent was obtained from all participants. The analytic data used here are de-identified and publicly available.
Mortality follow-up was ascertained through linkage with the National Death Index (NDI) up to December 31, 2019, as provided by NCHS. All-cause (non-accidental) mortality was the primary outcome. Follow-up time was months between examination and death or censored in December 2019. Cause-of-death data were used to exclude accidental deaths; remaining mortality events reflect age-associated mortality risk.
All analyses incorporated the complex sampling design using survey weights, strata, and primary sampling units, ensuring nationally representative estimates (Lumley, 2004, 2023). Continuous variables were expressed as means (±SD), and categorical variables as weighted percentages, supplementary table S1 and S2.
Survival time was defined as months from baseline examination to death or censoring on December 31, 2019. Non-accidental mortality was modeled using survey-weighted Cox proportional hazards regression, svycoxph in R (Cox, 1972; Therneau & Grambsch, 2000). Candidate predictors included age, sex, smoking, total metabolic expenditure per week, average sleeping hours per day, systolic blood pressure (SBP), diastolic blood pressure (DBP), blood sugar (HbA1c), eGFR and self-reported history of diabetes and heart disease. Body mass index (BMI), average alcohol consumption, low-density lipoprotein cholesterol (LDL-C), high-density lipoprotein cholesterol (HDL-C), triglycerides, and C-reactive protein (CRP) were evaluated but excluded from the final models due to lack of independent association with mortality.
Nonlinear relationships were assessed using Martingale residuals and Wald χ² tests of spline terms (Therneau & Grambsch, 2000; Wood, 2017; Royston & Sauerbrei, 2007), supplementary figure S3 and table S4. Although age demonstrated strong statistical evidence of nonlinearity, we retained a linear specification for chronological age to permit derivation of an interpretable age-equivalent risk metric (Biological Age). Nonlinear spline terms were retained for blood sugar, which improved model fit without affecting interpretability. Knots were placed at survey-weighted percentiles, e.g. HbA1c at [35th, 65th].
In practice, most covariates displayed near-linear behavior; simplified spline terms (df = 1–2) were used only where diagnostics strongly supported nonlinearity.
The proportional hazards assumption was evaluated using Schoenfeld residuals (Therneau & Grambsch, 2000), supplementary table S6. No violations were observed for the full model while for the simplified model, age, sex, smoking, sleep, or heart disease history have no violation, physical activity (kcal_kg_week) showed evidence of non-proportional hazards (p = 0.008), though the effect was modest and the overall model showed good discrimination and calibration. Given that activity was not the primary focus, we retained the simple linear form and noted this as a limitation.
Variance inflation factors (VIFs), supplementary table S7, were below 5 for all variables except the spline terms for sugar intake, which showed VIFs between 7.9 and 9.6. This is expected because spline basis functions are mathematically correlated with each other and does not indicate problematic multicollinearity (Wood, 2017). Pairwise correlations among non-spline predictors were all <0.4, suggesting no evidence of collinearity that would bias estimates or impair model stability.
From each fitted model (simple and full), we extracted coefficients βi. The contribution to mortality risk from all predictors except chronological age was summed as a risk score. Biological Age for individual i was derived by scaling coefficients relative to chronological age (Klemera & Doubal, 2006; Levine, 2013):
BioAgei=Agei+jagejXijage
For models where age was modeled via splines, we used numerical inversion methods (i.e. solving for the age value that equates the full linear predictor) to maintain consistency.
We applied the fixed coefficients from NHANES 2005–2009 models to the validation dataset to compute individual risk scores and Biological Age. Validation used Harrell’s C-index and calibration slope to assess discrimination and calibration (Harrell et al., 1996) and Kaplan–Meier survival curves stratified by BioAge quartiles.
All analyses were conducted in R 4.5.1 (R Core Team, 2024), using the survey, survival, and splines packages. Two-sided p-values <0.05 were considered statistically significant.
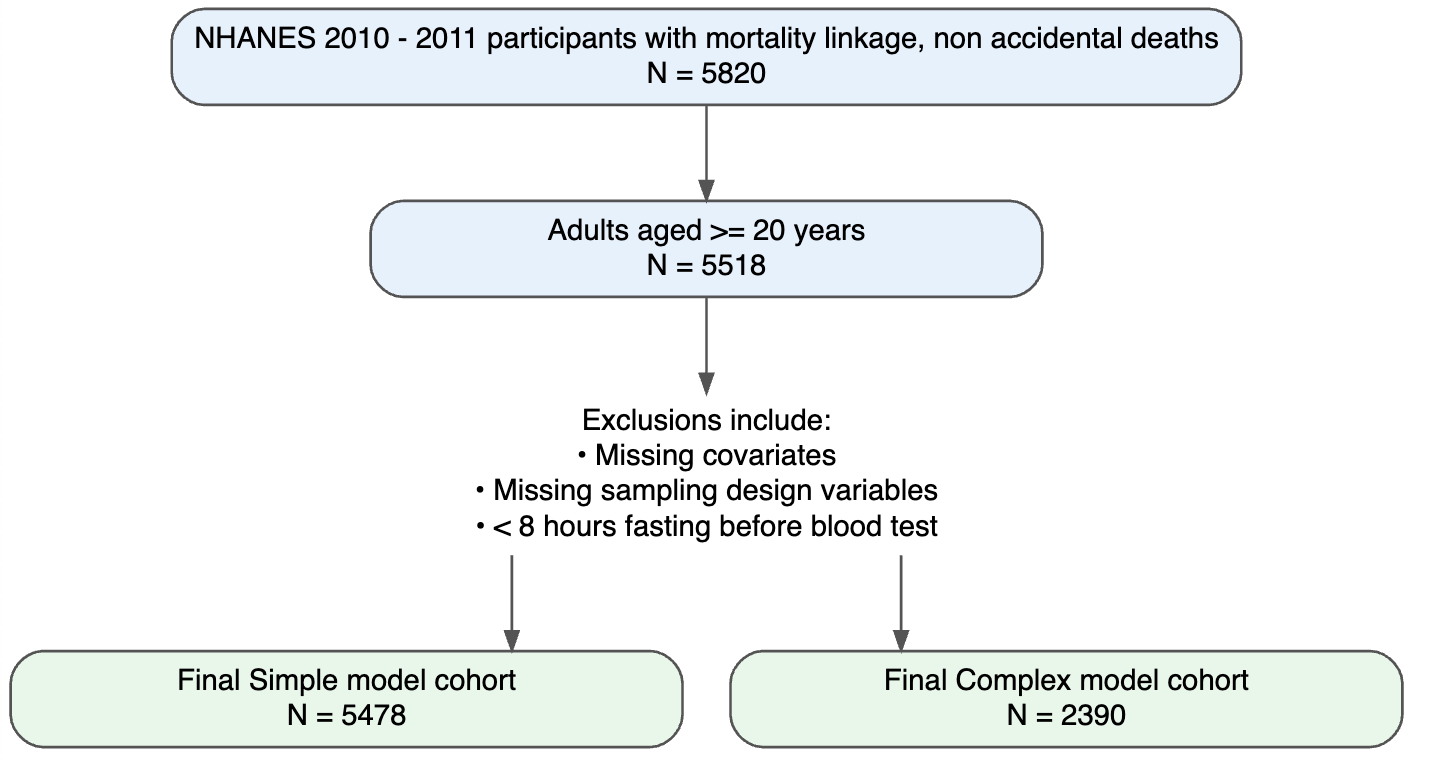
Figure 1. Flow of participants for development and validation data sets
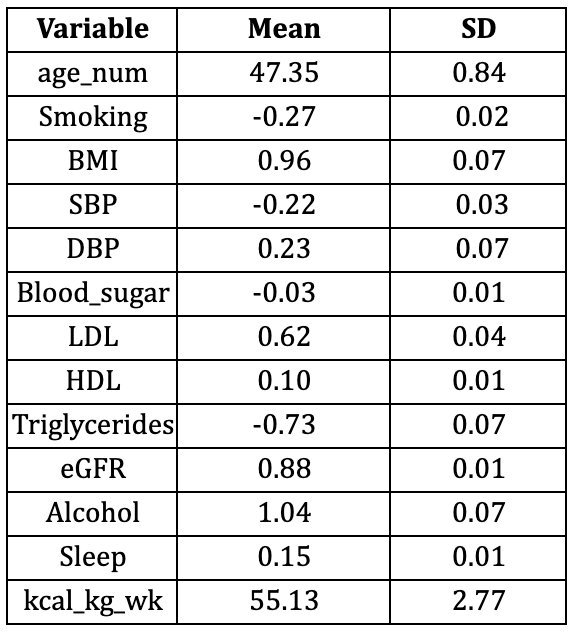
Baseline characteristics of participants in NHANES 2005–2009 and NHANES 2010–2011 are presented in Supplementary Table 1 and Table 2, respectively. Overall, the validation sample is older, has higher eGRF and total metabolic expenditure per week, but distributions of all other covariates were broadly comparable.
During a median follow-up of 11 years (IQR 9.67 – 12.42), a total of 6,844 deaths occurred among 16,878 participants included in the simplified model, and 1,106 deaths among 7,7775 participants in the full analytic model that required biomarker data.
In the model including age, sex, smoking, average sleeping hours per day, total metabolic expenditure per week and heart disease history, all predictors were significantly associated with mortality risk (Table 1).
This model demonstrated excellent discrimination, with a concordance statistic of 0.87 (SE 0.005).
Table 1. Simplified Cox Model Results (n = 14,387; events = 2,164)
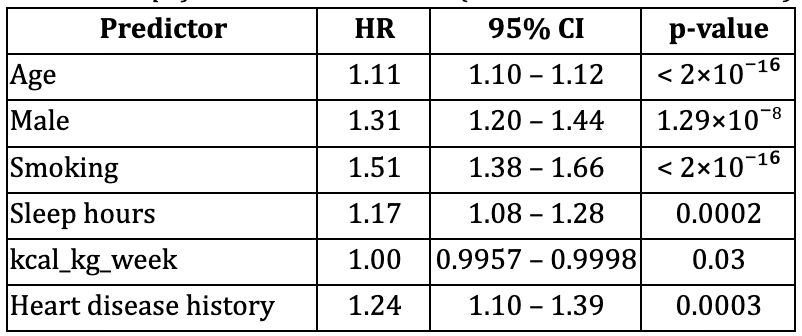
Concordance (C-statistic) = 0.87 (SE 0.005)
Full analytic model (including biomarkers with splines):
The full model incorporated spline terms for blood sugar (HbA1c) and demonstrated significant nonlinearity (Royston & Sauerbrei, 2007), Table 2.
This model demonstrated excellent discrimination, with a concordance statistic of 0.873 (SE 0.007). Wald tests confirmed strong departures from linearity for blood sugar refer to Supplementary Table 3
Table 2. Full Cox Model Results (n = 7,775; events = 1,106)
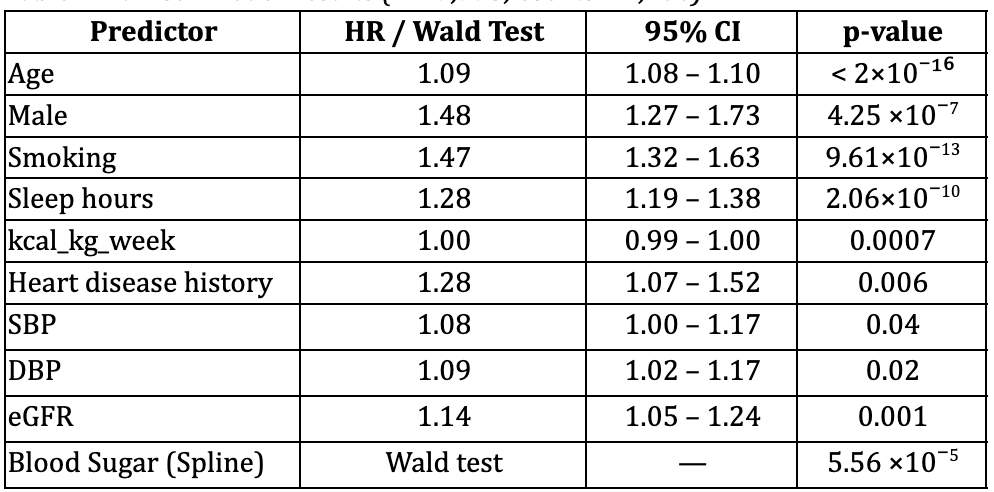
Concordance (C-statistic) = 0.873 (SE 0.007)
Simplified Model
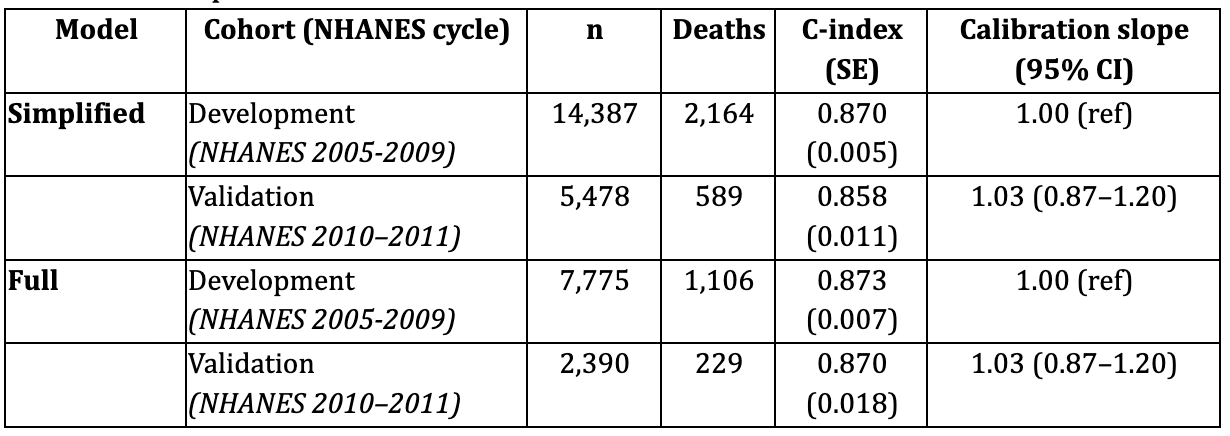
In the external NHANES 2010–2011 validation cohort (n = 5,478; 589 deaths), the simplified risk model continued to show strong predictive performance. Model discrimination remained excellent, with a C-index of 0.858 (SE ≈ 0.011). Calibration analysis demonstrated a slope of 1.03 (95% CI: 0.87–1.20), indicating good agreement between predicted and observed risks. Risk stratification using tertiles of predicted risk yielded clear separation in 5-year survival probabilities (Low risk: 99.6%, Mid risk: 98.7%, High risk: 89.1%).
Full Model
In the biomarker-rich validation cohort (NHANES 2010–2011; n = 2,390; 229 deaths), the full spline-based model also robustly predicted mortality. Discrimination was strong, with a C-index of 0.870 (SE ≈ 0.018). Calibration was close to ideal (slope = 1.03, 95% CI: 0.87–1.20). Kaplan–Meier curves across predicted risk groups showed graded and monotonic separation, confirming stable model transportability.
Table 3. Model performance in derivation and validation cohorts
Summary
Both the simplified and full Biological Age models demonstrated excellent discrimination and satisfactory calibration in the independent NHANES 2010–2011 cohort, confirming robustness and generalizability.
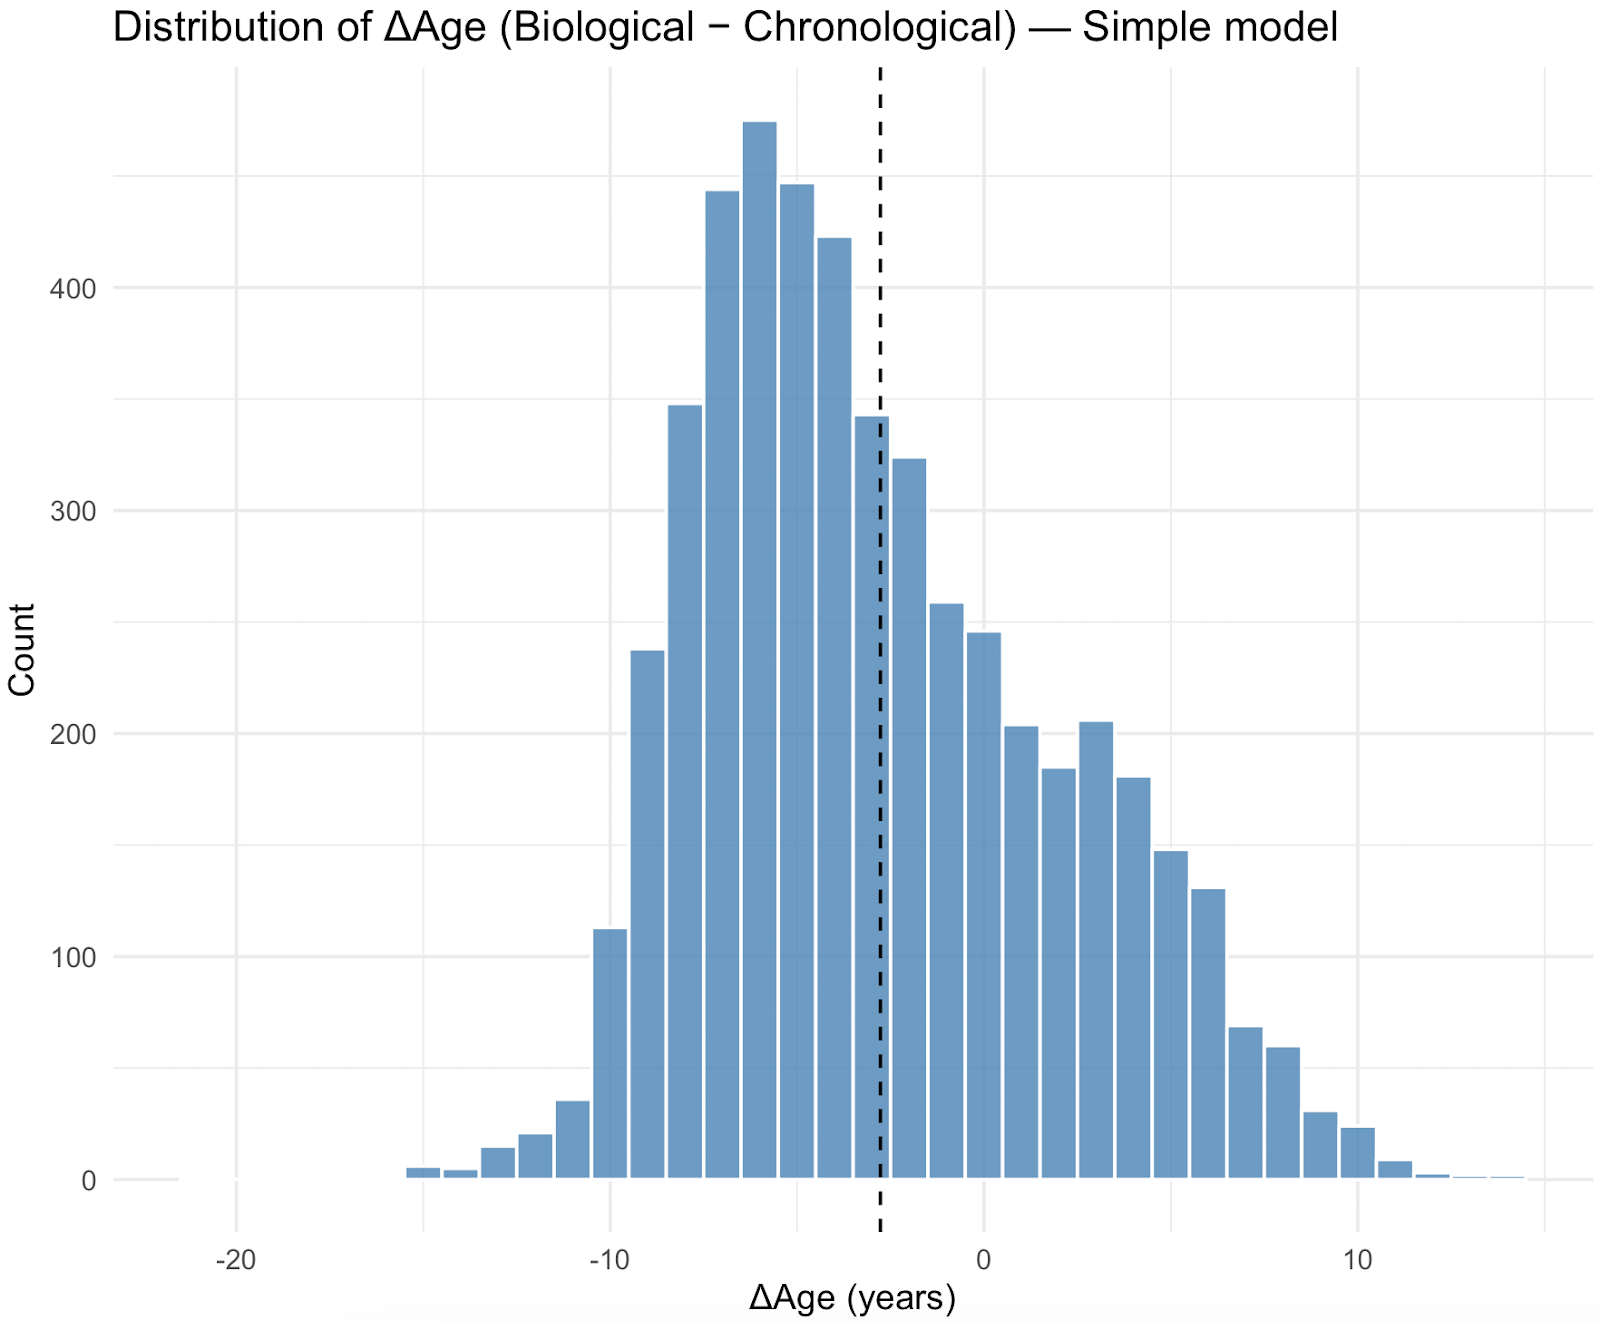
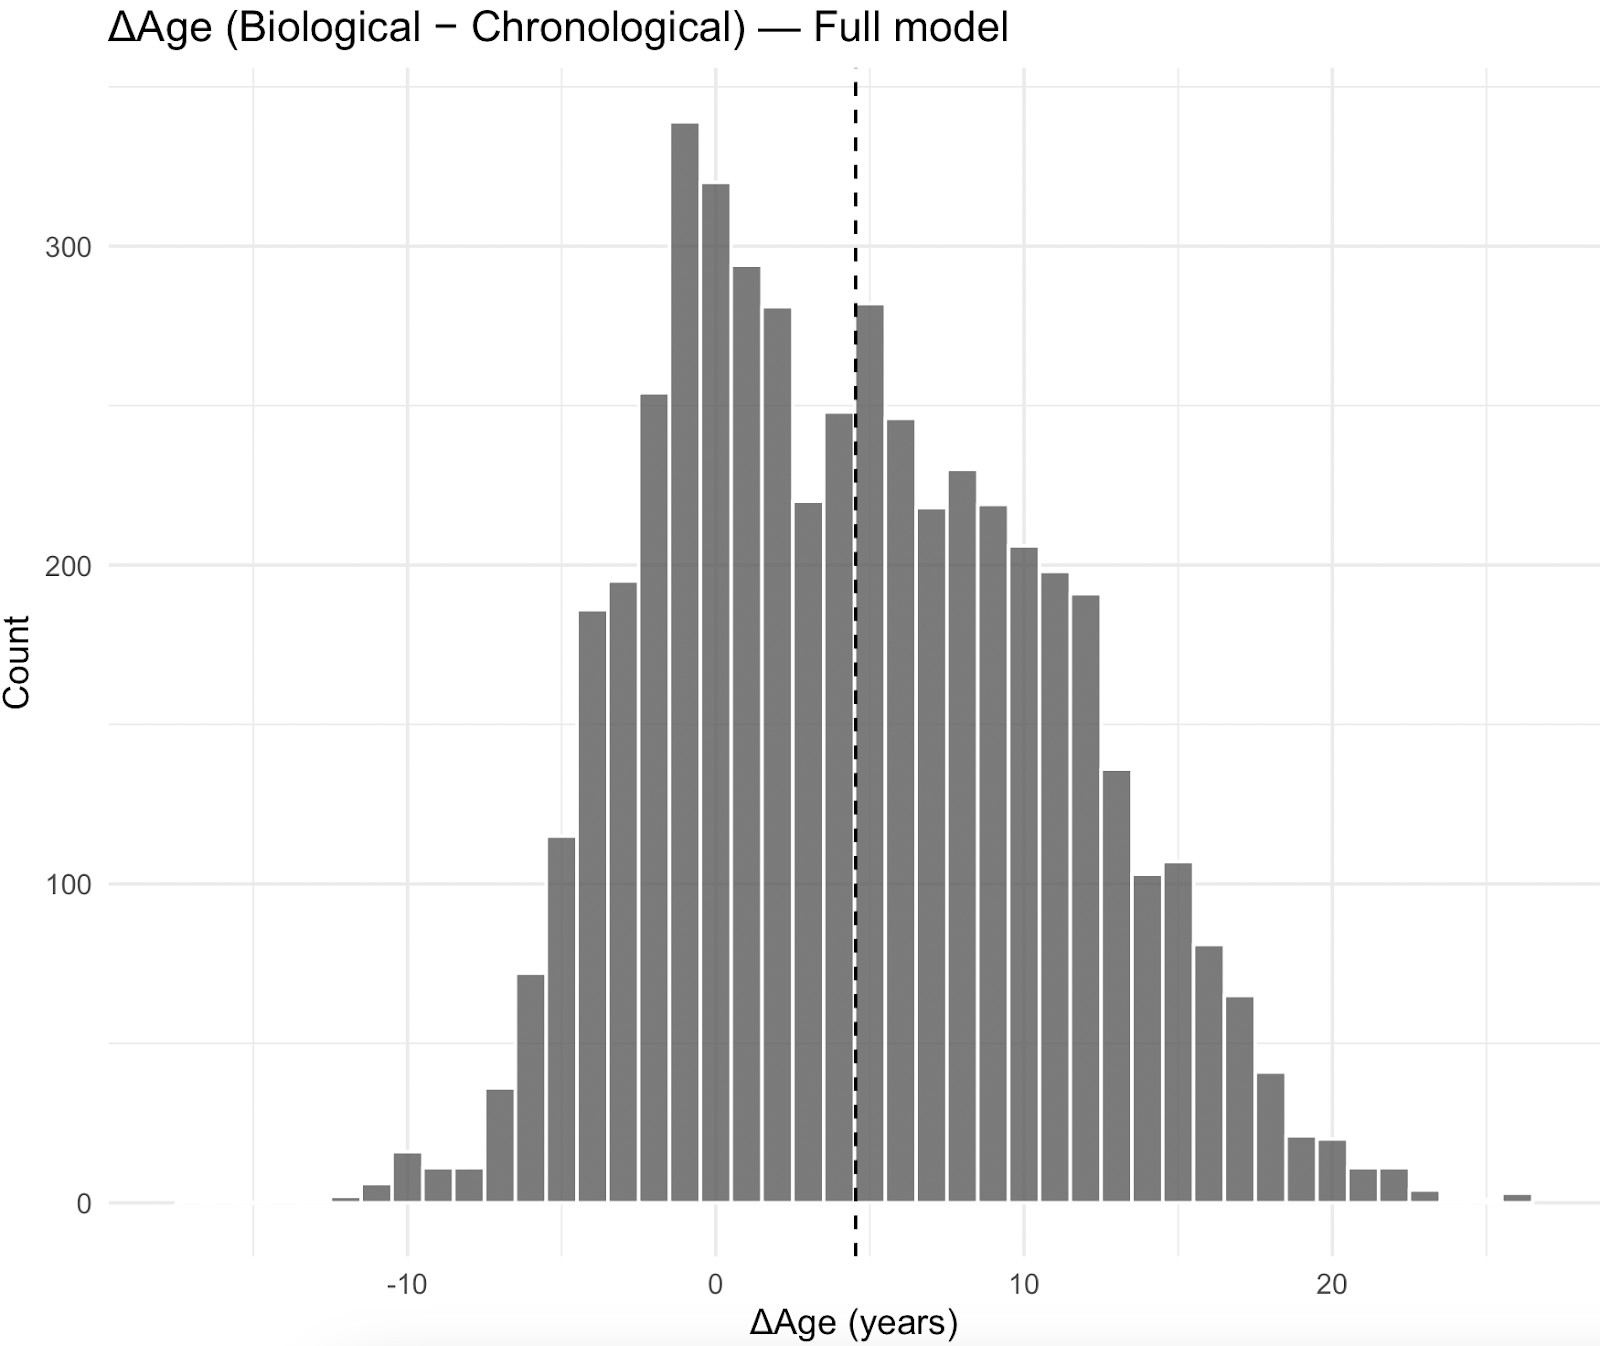
The distribution of Biological Age relative to chronological age (ΔAge) was centered more negatively for the simplified model, with a mean difference of -2.98years (SD 4.82) while the full model has a mean difference of 4.09years (SD 6.22), estimated with NHANES survey weights.
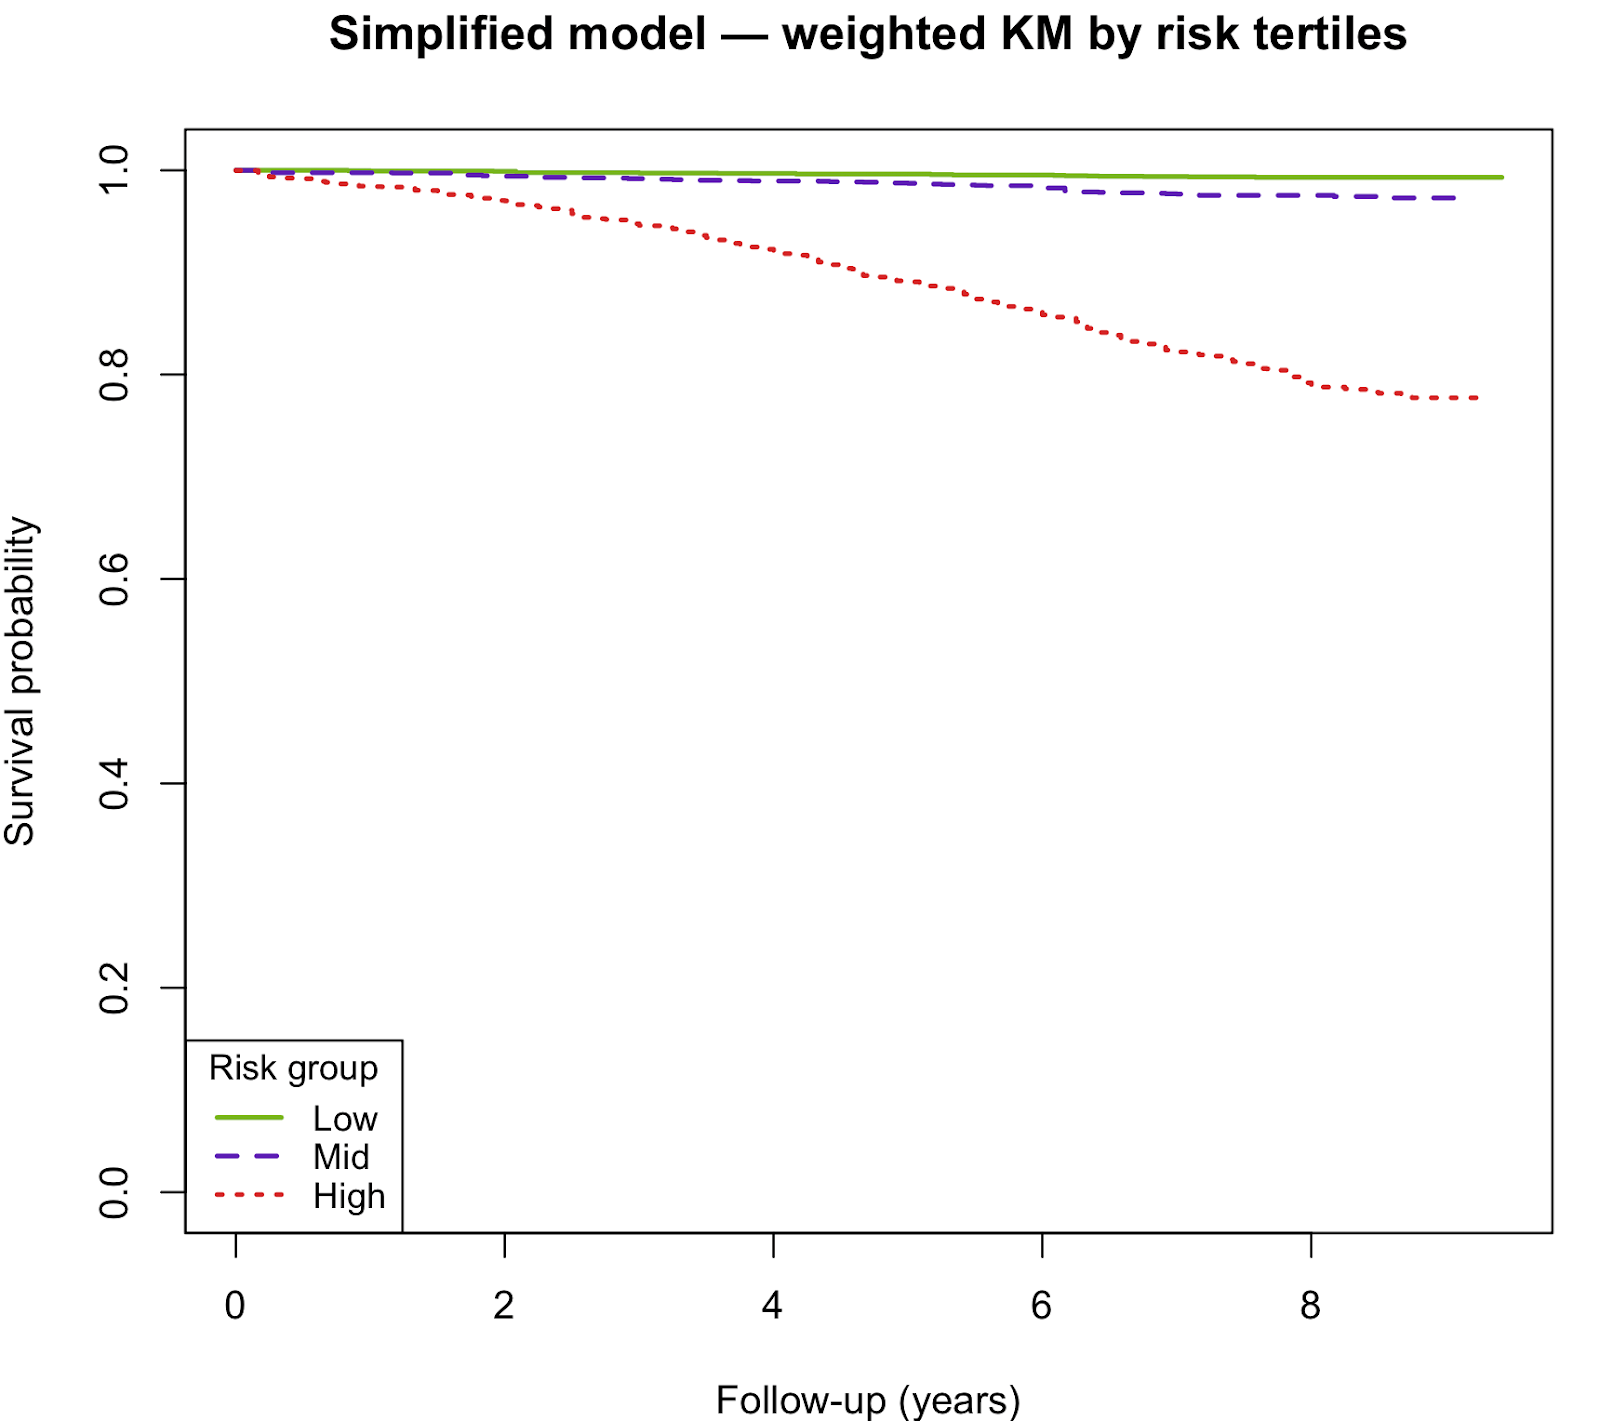
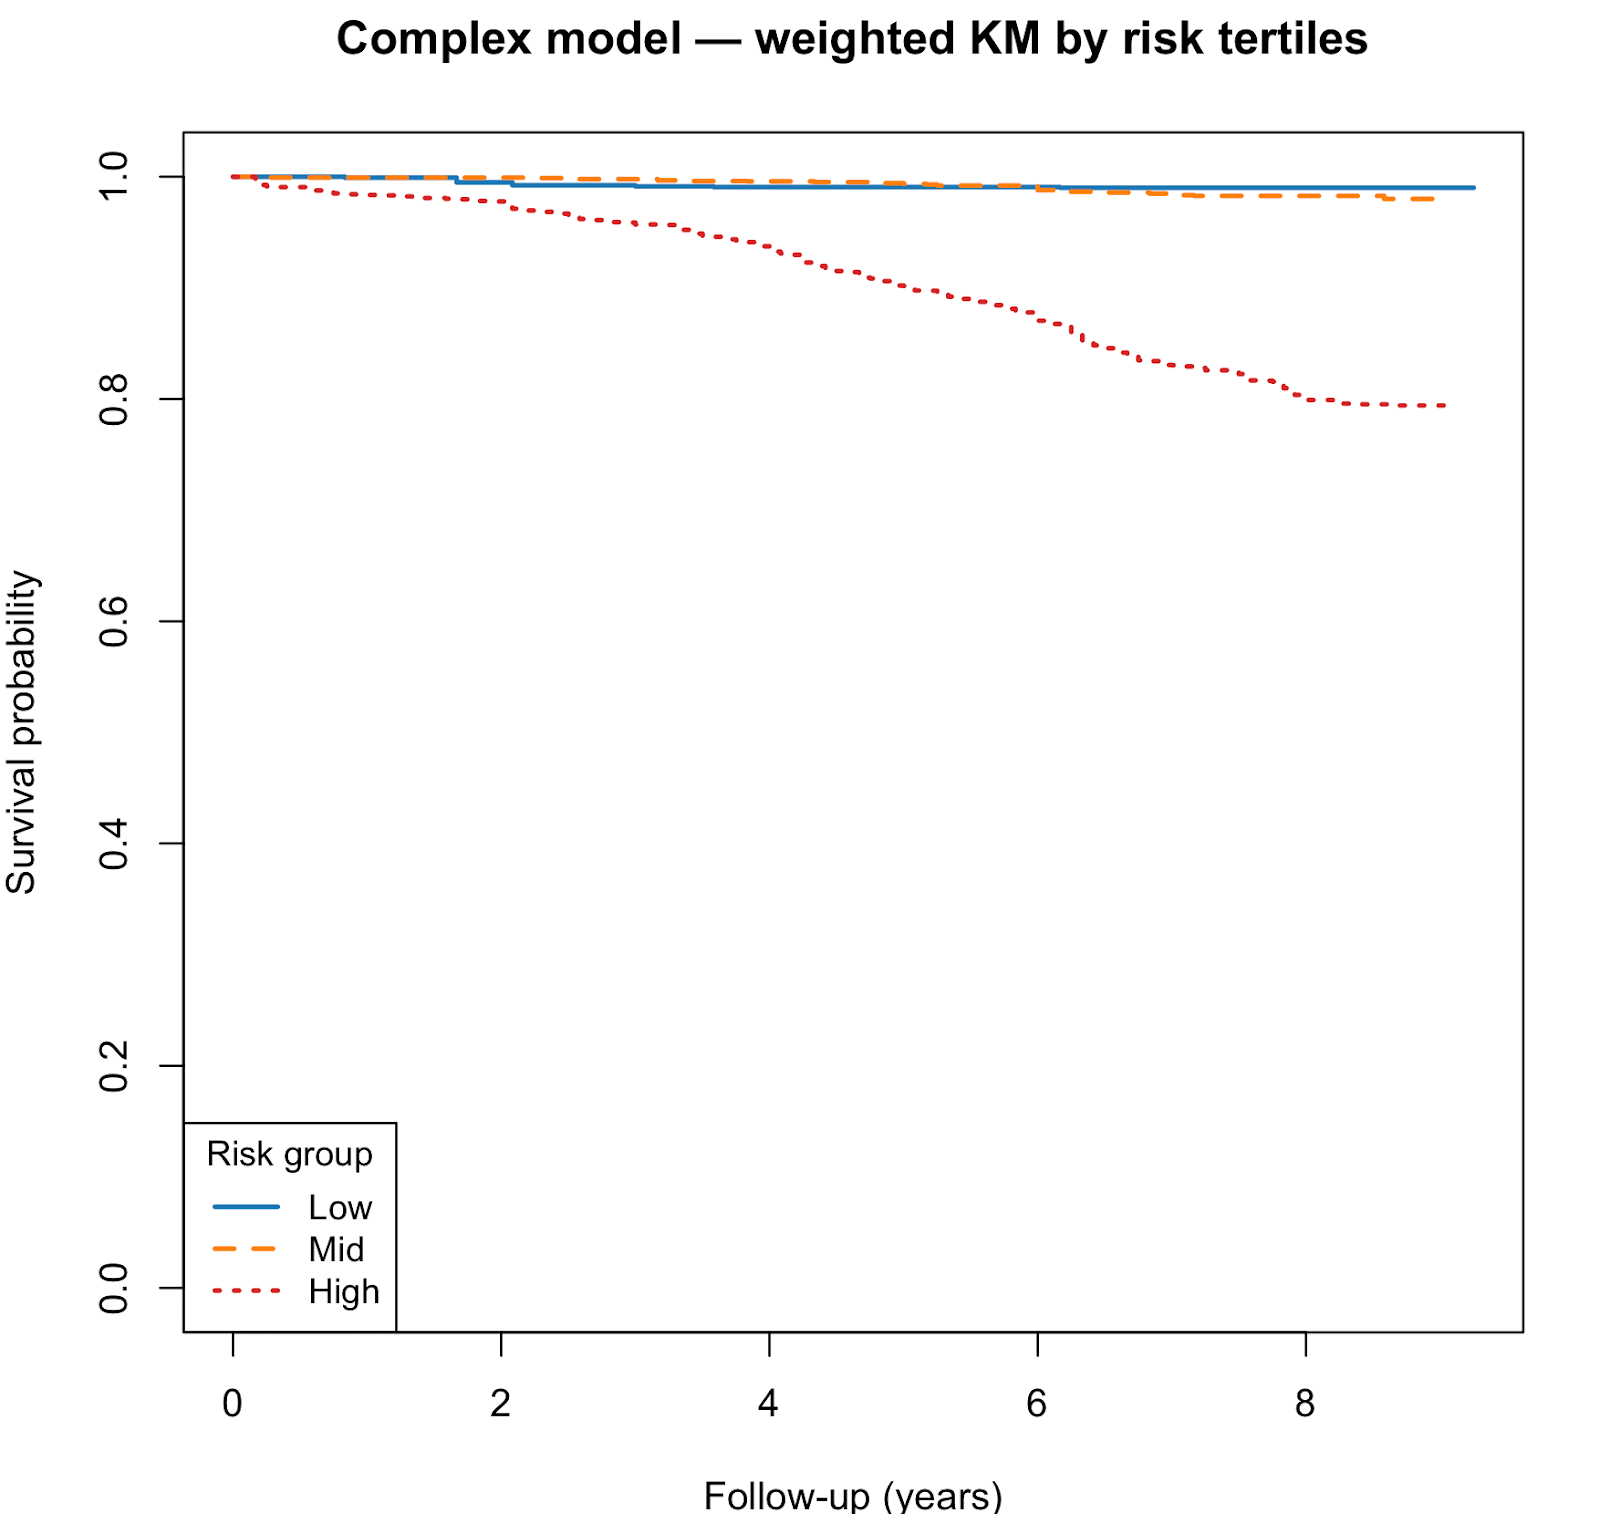
Kaplan–Meier curves showed clear separation of survival curves across risk tertiles. High-risk groups had substantially lower survival than mid- and low-risk groups.
We derived and validated Biological Age, a transparent mortality risk score expressed in age-equivalent terms. Both the simple and complex models demonstrated excellent discrimination and calibration (Harrell et al., 1996). The simple model is parsimonious and interpretable, while the complex model integrates biomarkers for slightly improved performance.
Strengths of this study include the use of large, nationally representative NHANES cohorts (2005–2009 for model development and 2010–2011 for external validation), with standardized examination, laboratory measures, and mortality linkage through 2019. The relatively recent cohorts improve relevance to contemporary populations compared with older studies. The availability of survey weights allowed population-level inferences, and our analytic approach incorporated flexible spline modeling to capture nonlinear associations. Rigorous model diagnostics (e.g., proportional hazards testing, multicollinearity checks, residual assessments) and external validation further strengthen confidence in the findings.
However, several limitations warrant consideration. First, residual confounding and measurement error are possible, particularly for self-reported exposures such as smoking, alcohol, and physical activity. Second, our use of complete-case data for laboratory variables may introduce bias if missingness was not random, although survey weighting and sensitivity analyses mitigate this concern; future work could apply multiple imputation. Third, biomarkers were measured at a single baseline timepoint, preventing assessment of within-person trajectories and dynamic “pace-of-aging” processes. Fourth, competing risks were not modeled, and cause-specific mortality was not examined. Fifth, the proportional hazards test suggested non-proportionality for physical activity (kcal/kg/week, p = 0.008). We retained this variable in linear form for simplicity, but acknowledge this as a limitation that may attenuate effect estimation over time. Sixth, the use of capped linear risk scores and truncation for spline fitting represents a pragmatic simplification but may introduce model misspecification; nevertheless, sensitivity analyses supported the robustness of the main results.
While the present study leverages the breadth and representativeness of NHANES, several domains relevant to holistic aging could not be validated owing to data structure, measurement limitations, or statistical non-significance after multivariable adjustment.
The absence or lack of significance should be interpreted cautiously, given known NHANES constraints such as self-report bias, medication confounding, and single time-point measurement. Below we summarize the principal omitted or attenuated factors and explain both their biological relevance and the rationale for their inclusion in the Elfie Biological Age model to support self-monitoring and early detection of modifiable risks.
Sleep Architecture (REM and Deep-Sleep Percentages)
NHANES captures total sleep duration but lacks polysomnography-derived data on sleep stages, including REM and slow-wave (deep) sleep, which are unavailable in the mortality-linked waves. Longitudinal cohorts such as the MrOS and Wisconsin Sleep studies demonstrate that lower REM proportion and reduced deep sleep independently predict all-cause and cardiovascular mortality and are mechanistically linked to impaired metabolic recovery and neurodegeneration (Yaffe, Laffan, Harrison, Redline, & Ensrud, 2019; Lauderdale et al., 2020). Because these data were absent, our model could not quantify this restorative component of sleep. Elfie incorporates wearable-derived REM and deep-sleep metrics to encourage users to monitor nightly recovery and detect deterioration in sleep quality over time.
Heart-Rate Variability (HRV)
Although NHANES includes resting heart rate, it lacks the continuous ECG sampling required to compute HRV indices. Reduced HRV is a robust and independent predictor of cardiovascular and all-cause mortality (Tsuji et al., 1996; Hillebrand et al., 2013). Elfie therefore maintains HRV as a physiological input in its device-linked implementation, where it functions both as a cardiovascular health marker and as an intuitive self-tracking indicator of stress resilience and recovery balance.
Medication Adherence
NHANES collects medication inventories but does not provide longitudinal adherence data. Yet consistent adherence substantially lowers cardiovascular and all-cause mortality (Simpson, Eurich, Majumdar, Padwal, & Johnson, 2006). Within Elfie, adherence is monitored through in-app refill tracking and reminder systems. Including adherence is intended not only to enhance predictive validity but also to promote sustained engagement in treatment routines and early detection of non-adherence patterns.
Dietary Quality
Although NHANES provides 24-hour dietary recalls, it lacks comprehensive longitudinal indices such as the Alternative Healthy Eating Index (AHEI-2010) across all linked waves. Diet quality remains a fundamental determinant of longevity: higher AHEI scores are associated with 20–30 % lower all-cause mortality and over 40 % lower cardiovascular mortality (Chiuve et al., 2012). Elfie integrates a nutrition score derived from Food Standards Agency modified Nutrient Profiling System (FSAm-NPS), designed to motivate self-assessment and gradual dietary improvement.
Vaccination Status
NHANES lacks consistent longitudinal vaccination data in its mortality-linked cohorts. Immunization—especially for influenza and pneumococcal disease—reduces infection-related and cardiovascular deaths in older adults (Udell et al., 2013). At the time of this study, Elfie is still developing vaccination tracking and reminders within its preventive-care module, encouraging proactive self-management of immunization coverage. Future Elfie releases will integrate this dimension.
Cognitive and Mental Health Measures
Validated tools such as PHQ-9, GAD-7, or EQ-5D are absent from the linked NHANES waves, limiting our ability to capture psychosocial stress and cognitive decline as drivers of biological aging. Depressive symptoms and low health-related quality of life are well-established predictors of morbidity and mortality (Penninx et al., 2001). Future Elfie releases will integrate short-form digital screening instruments for mood, anxiety, and perceived stress, supporting early recognition and self-care interventions.
Body Mass Index (BMI)
In this analysis, BMI was non-significant after multivariable adjustment, consistent with the “obesity paradox” observed in older cohorts. Central adiposity measures such as waist-to-hip ratio are often more strongly linked to mortality (Zhou et al., 2021). However, Elfie deliberately retains BMI—adjusted for ethnicity—as a core user-facing indicator because of its accessibility, interpretability, and educational value in promoting weight awareness. When available, users are encouraged to track their body-fat ratio instead of BMI to differentiate between lean mass and fat mass changes, thereby supporting realistic goal-setting and early detection of adverse body-composition trends.
LDL Cholesterol
The absence of an independent LDL association likely reflects treatment and survival bias; LDL lowering is causally linked to reduced atherosclerotic events (Cholesterol Treatment Trialists’ Collaboration, 2010). Elfie maintains LDL as a laboratory-derived factor in its advanced tier to enhance user understanding of cardiovascular risk and encourage timely lipid testing.
Alcohol Intake
No consistent directional effect was observed in NHANES. Recent meta-analyses indicate that no level of alcohol consumption confers a net health benefit (GBD 2016 Alcohol Collaborators, 2018). Elfie retains this behavioral factor primarily for self-awareness, allowing users to visualize consumption patterns and receive motivational feedback to reduce intake.
Resting Heart Rate
After adjusting for physical activity and blood pressure, resting heart rate lost statistical significance. Nonetheless, higher resting rates remain a consistent predictor of greater mortality risk (Zhang, Shen, & Qi, 2016). Elfie includes resting heart rate from wearable devices as a real-time signal of fitness, stress, and recovery status, motivating users to improve activity and cardiorespiratory efficiency.
⸻
Summary
These limitations underscore that NHANES—though uniquely representative and invaluable for validation—cannot encompass all dimensions of biological aging relevant to preventive health engagement. The Elfie Biological Age framework therefore extends beyond the NHANES dataset by integrating behavioral, physiological, and adherence metrics specifically chosen to promote self-monitoring, early detection of risk factors, and sustained user engagement in health improvement behaviors that epidemiological datasets alone cannot capture.
By translating complex survival models into an intuitive age-equivalent scale, Biological Age offers a powerful communication tool for personalized risk feedback (Ganna & Ingelsson, 2015). Clinicians can use Biological Age to illustrate the cumulative effects of modifiable risk factors, providing a relatable benchmark that complements conventional absolute risk estimates. Public health agencies could apply the simplified model in low-resource settings or population surveys where biomarker data are limited, while the full model may serve in clinical or research contexts requiring greater precision. Further validation of Biological Age across contemporary cohorts, diverse populations, and with cause-specific mortality outcomes will be important to establish its generalizability. Integration into digital health platforms may also enable real-time personalized risk feedback at scale.
Conceptualization: Jean-François Legourd, Otávio Berwanger
Methodology: Serene Toh, Jean-François Legourd
Data Curation and Formal Analysis: Serene Toh
Validation: Serene Toh
Writing – Original Draft: Serene Toh
Writing – Review & Editing: Otávio Berwanger, Jean-François Legourd
Supervision & Scientific Oversight: Otávio Berwanger
Funding & Project Administration: Jean-François Legourd
All authors approved the final version of the manuscript and agree to be accountable for the work presented.
This study used publicly available data from the U.S. National Health and Nutrition Examination Survey (NHANES) conducted by the Centers for Disease Control and Prevention (CDC).
Data are accessible at https://www.cdc.gov/nchs/nhanes/ under open public-use agreements.
Linked mortality follow-up data were obtained from the National Center for Health Statistics (NCHS) Public-Use Linked Mortality Files, available at https://www.cdc.gov/nchs/data-linkage/mortality-public.htm
All statistical code used for model estimation and validation is available upon reasonable request to the corresponding author (jf@elfie.co).
Jean-François Legourd and Serene Toh are affiliated with Elfie Inc., which supported this study. The authors declare no other conflicts of interest.
The authors used artificial intelligence tools (OpenAI ChatGPT) to assist in writing and editing this manuscript, specifically to enhance grammar, clarity, and orthographic consistency.
In addition, AI tools were employed to generate R script templates for data transformation and model preparation related to Cox proportional hazards analyses.
All code generated by AI was reviewed, tested, and validated by the authors prior to use in the final analyses.
No AI system was used for autonomous statistical modeling, result interpretation, or decision-making.
The authors take full responsibility for the integrity, reproducibility, and accuracy of all analyses and content presented.
This work was supported by Elfie Inc., an American health technology company, which integrates the model as the Elfie Biological Age feature in its free health engagement platform accessible to millions of users worldwide in its public health mission to encourage self-monitoring.
The authors gratefully acknowledge the National Center for Health Statistics (NCHS) and the U.S. Centers for Disease Control and Prevention (CDC) for providing open access to the National Health and Nutrition Examination Survey (NHANES) and its Linked Mortality Files. The NHANES program represents a unique public investment in open, longitudinal, and data-rich population research that has enabled thousands of independent studies worldwide.
We recognize that the United States remains one of the few countries offering such comprehensive and freely accessible health and mortality datasets, which greatly foster global scientific collaboration and accelerate methodological innovation. We hope that comparable longitudinal, diverse, and openly accessible cohorts will emerge internationally to enhance inclusion, representativity, and progress in population-health research.
Benetos, A., Petrovic, M., & Strandberg, T. (2019). Hypertension management in older and frail older patients. Circulation Research, 124(7), 1045–1060. https://doi.org/10.1161/CIRCRESAHA.118.313236
Centers for Disease Control and Prevention (CDC). (2025). National Health and Nutrition Examination Survey (NHANES): About the NHANES. National Center for Health Statistics. https://www.cdc.gov/nchs/nhanes/index.htm
Chiuve, S. E., Fung, T. T., Rimm, E. B., Hu, F. B., McCullough, M. L., Wang, M., Stampfer, M. J., & Willett, W. C. (2012). Alternative Healthy Eating Index and mortality. The Journal of Nutrition, 142(6), 1003–1008. https://doi.org/10.3945/jn.111.157222
Cholesterol Treatment Trialists’ Collaboration. (2010). Efficacy and safety of more intensive lowering of LDL cholesterol: A meta-analysis of data from 170,000 participants in 26 randomised trials. The Lancet, 376(9753), 1670–1681. https://doi.org/10.1016/S0140-6736(10)61350-5
Cox, D. R. (1972). Regression models and life-tables. Journal of the Royal Statistical Society: Series B (Methodological), 34(2), 187–220.
Emerging Risk Factors Collaboration. (2009). Major lipids, apolipoproteins, and risk of vascular disease. JAMA, 302(18), 1993–2000. https://doi.org/10.1001/jama.2009.1619
Ganna, A., & Ingelsson, E. (2015). 5-year mortality predictors in 498,103 UK Biobank participants: A prospective population-based study. The Lancet, 386(9993), 533–540. https://doi.org/10.1016/S0140-6736(15)60175-1
GBD 2016 Alcohol Collaborators. (2018). Alcohol use and burden for 195 countries and territories, 1990–2016: A systematic analysis for the Global Burden of Disease Study 2016. The Lancet, 392(10152), 1015–1035. https://doi.org/10.1016/S0140-6736(18)31310-2
Goldwasser, P., & Feldman, J. (1997). Association of serum albumin and mortality risk. The American Journal of Medicine, 103(6), 495–502. https://doi.org/10.1016/S0002-9343(97)00236-9
Harrell, F. E. Jr., Lee, K. L., & Mark, D. B. (1996). Multivariable prognostic models: Issues in developing models, evaluating assumptions and adequacy, and measuring and reducing errors. Statistics in Medicine, 15(4), 361–387. https://doi.org/10.1002/(SICI)1097-0258(19960229)15:4<361::AID-SIM168>3.0.CO;2-4
Hillebrand, S., Gast, K. B., de Mutsert, R., Swenne, C. A., Jukema, J. W., Middeldorp, S., … Dekker, J. M. (2013). Heart rate variability and first cardiovascular event in populations without known cardiovascular disease: Meta-analysis and dose-response meta-regression. European Heart Journal, 34(38), 2679–2686. https://doi.org/10.1093/eurheartj/eht185
Klemera, P., & Doubal, S. (2006). A new approach to the concept and computation of biological age. Mechanisms of Ageing and Development, 127(3), 240–248. https://doi.org/10.1016/j.mad.2005.10.004
Levine, M. E. (2013). Modeling the rate of aging: A biological age estimation approach using multiple biomarkers. The Journals of Gerontology: Series A, 68(6), 667–674. https://doi.org/10.1093/gerona/gls233
Liu, Z., Kuo, P. L., Horvath, S., Crimmins, E., Ferrucci, L., & Levine, M. E. (2018). A new aging measure captures morbidity and mortality risk across diverse subpopulations from NHANES IV: A cohort study. PLOS Medicine, 15(12), e1002718. https://doi.org/10.1371/journal.pmed.1002718
Loprinzi, P. D., & Cardinal, B. J. (2011). Association between objectively measured physical activity and sleep, NHANES 2005–2006. Mental Health and Physical Activity, 4(2), 65–69. https://doi.org/10.1016/j.mhpa.2011.08.001
Lumley, T. (2004). Analysis of complex survey samples. Journal of Statistical Software, 9(1), 1–19. https://doi.org/10.18637/jss.v009.i08
Lumley, T. (2023). survey: Analysis of Complex Survey Samples (R package version 4.3.2). https://CRAN.R-project.org/package=survey
Myers, J., Prakash, M., Froelicher, V., Do, D., Partington, S., & Atwood, J. E. (2002). Exercise capacity and mortality among men referred for exercise testing. The New England Journal of Medicine, 346(11), 793–801. https://doi.org/10.1056/NEJMoa011858
Penninx, B. W. J. H., Guralnik, J. M., Mendes de Leon, C. F., Pahor, M., Visser, M., Corti, M. C., Wallace, R. B., & Berkman, L. F. (2001). Cardiovascular events and mortality in depressed older men and women: A prospective community-based study. Archives of General Psychiatry, 58(3), 221–227. https://doi.org/10.1001/archpsyc.58.3.221
R Core Team. (2024). R: A language and environment for statistical computing. R Foundation for Statistical Computing. https://www.R-project.org/
Rehm, J., Gmel, G., Gmel, G., et al. (2017). The relation between different dimensions of alcohol consumption and burden of disease: An overview. Addiction, 112(1), 101–107. https://doi.org/10.1111/add.13455
Royston, P., & Sauerbrei, W. (2007). Multivariable model-building: A pragmatic approach to regression analysis based on fractional polynomials for modelling continuous variables. Wiley. https://doi.org/10.1002/9780470722184
Simpson, S. H., Eurich, D. T., Majumdar, S. R., Padwal, R. S., & Johnson, J. A. (2006). A meta-analysis of the association between adherence to drug therapy and mortality. JAMA, 296(21), 2643–2653. https://doi.org/10.1001/jama.296.21.2643
Therneau, T. M., & Grambsch, P. M. (2000). Modeling survival data: Extending the Cox model. Springer-Verlag. https://doi.org/10.1007/978-1-4757-3294-8
Tsuji, H., Venditti, F. J., Manders, E. S., Evans, J. C., Larson, M. G., Feldman, C. L., & Levy, D. (1996). Reduced heart rate variability and mortality risk in an elderly cohort. Circulation, 94(11), 2850–2855. https://doi.org/10.1161/01.CIR.94.11.2850
Udell, J. A., Zawi, R., Bhatt, D. L., Keshtkar-Jahromi, M., Gaughran, F., Phrommintikul, A., … Cannon, C. P. (2013). Association between influenza vaccination and cardiovascular outcomes in high-risk patients: A meta-analysis. JAMA, 310(16), 1711–1720. https://doi.org/10.1001/jama.2013.279206
Wood, S. N. (2017). Generalized additive models: An introduction with R (2nd ed.). CRC Press. https://doi.org/10.1201/9781315370279
Yaffe, K., Laffan, A. M., Harrison, S. L., Redline, S., & Ensrud, K. E. (2019). Sleep-disordered breathing, hypoxia, and risk of mild cognitive impairment and dementia in older women. JAMA Neurology, 76(6), 653–660. https://doi.org/10.1001/jamaneurol.2018.4719
Zhang, D., Shen, X., & Qi, X. (2016). Resting heart rate and all-cause and cardiovascular mortality in the general population: A meta-analysis. Heart, 102(8), 701–708. https://doi.org/10.1136/heartjnl-2015-308963
Zhou, B., Carrillo-Larco, R. M., Danaei, G., Riley, L. M., Paciorek, C. J., Stevens, G. A., … Ezzati, M. (2021). Worldwide trends in body-mass index, underweight, overweight, and obesity from 1975 to 2016: A pooled analysis of 2416 population-based measurement studies. JAMA Network Open, 4(9), e2128938. https://doi.org/10.1001/jamanetworkopen.2021.28938
Weighted baseline characteristics
Table S1: Continuous and binary variables for simple model with NHANES 2005–2009
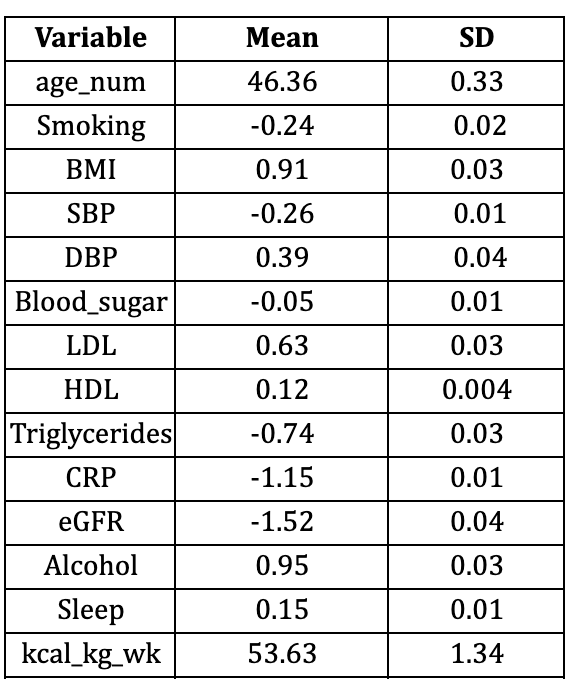
Table S2: Continuous and binary variables for simple model with NHANES 2010–2011
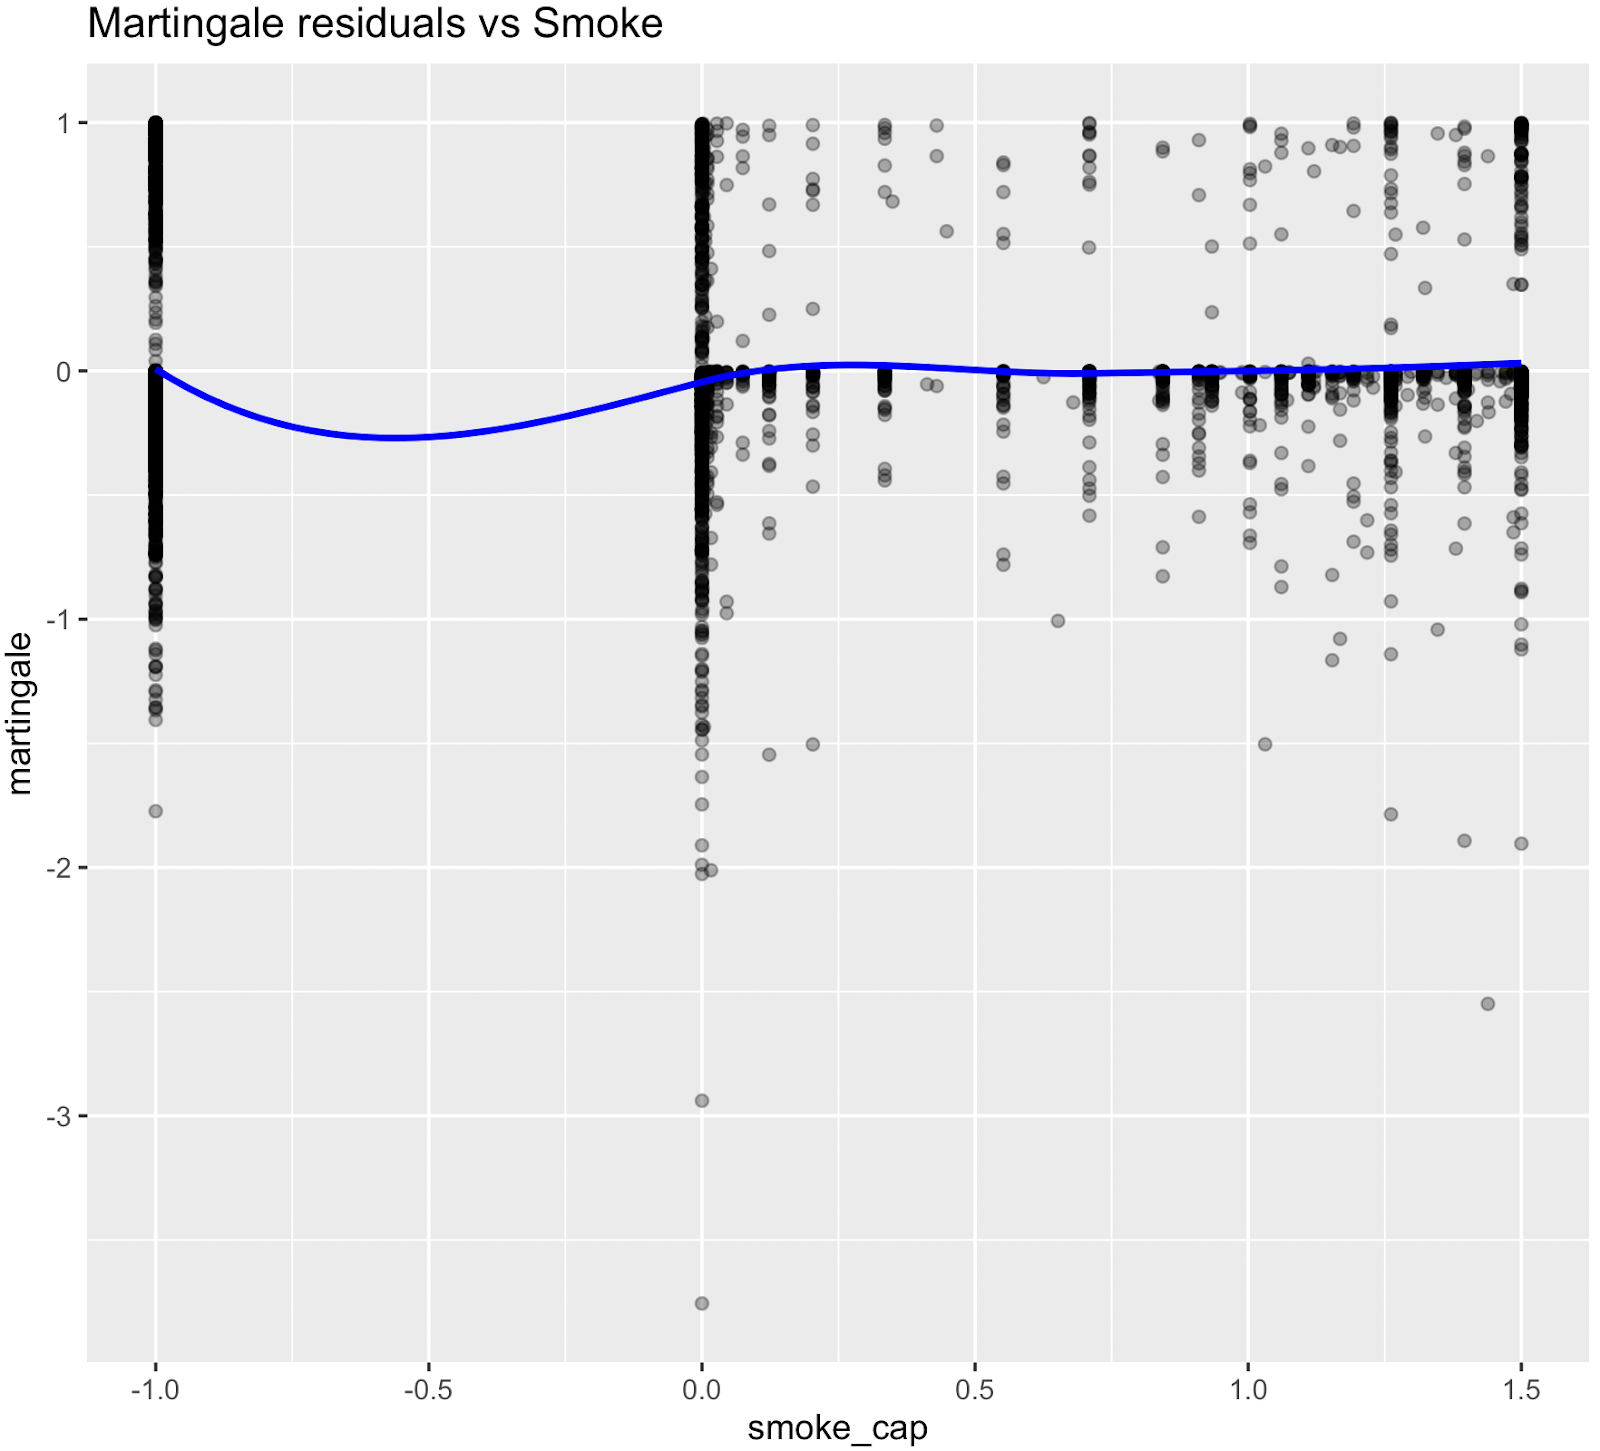
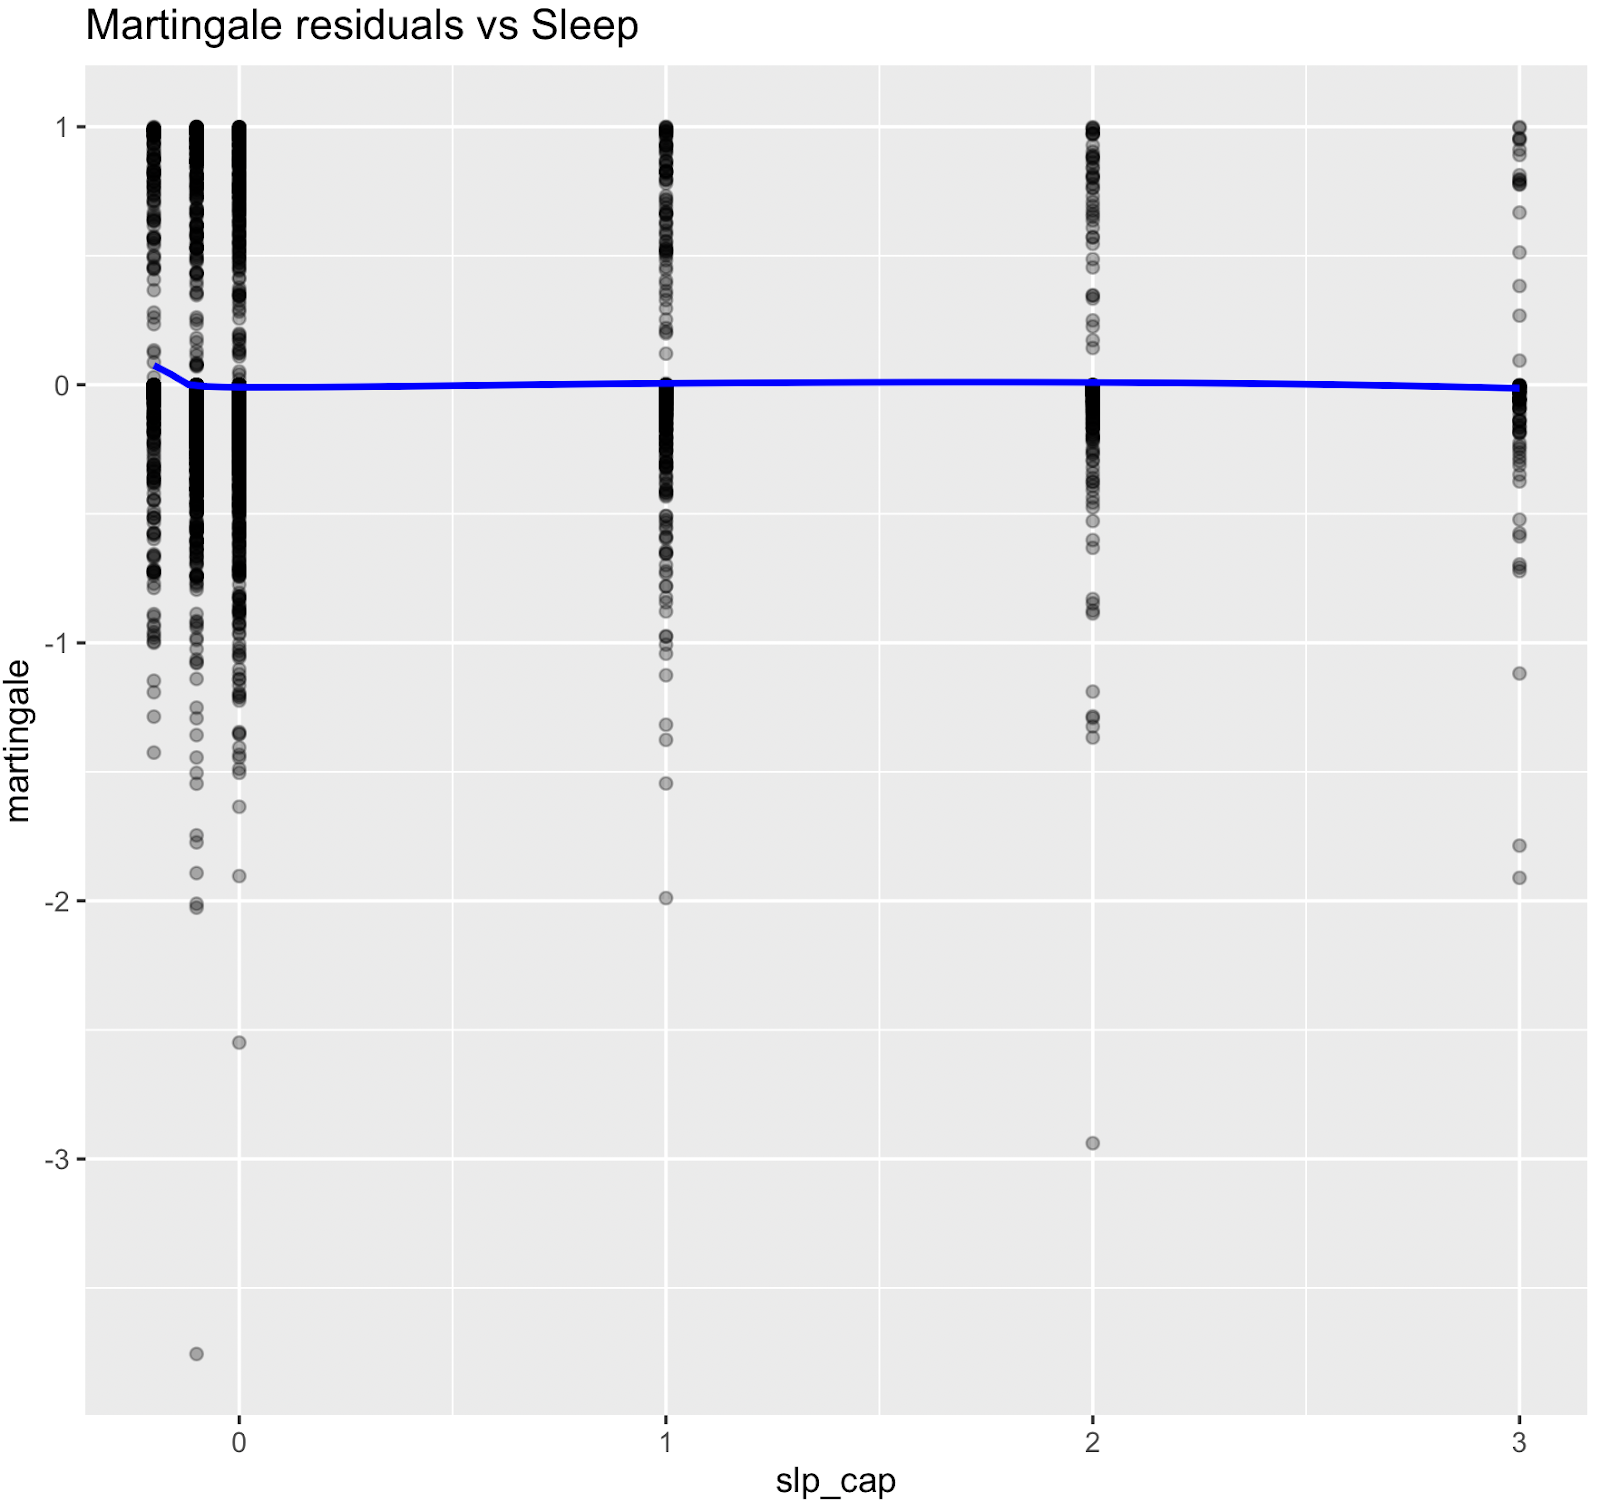
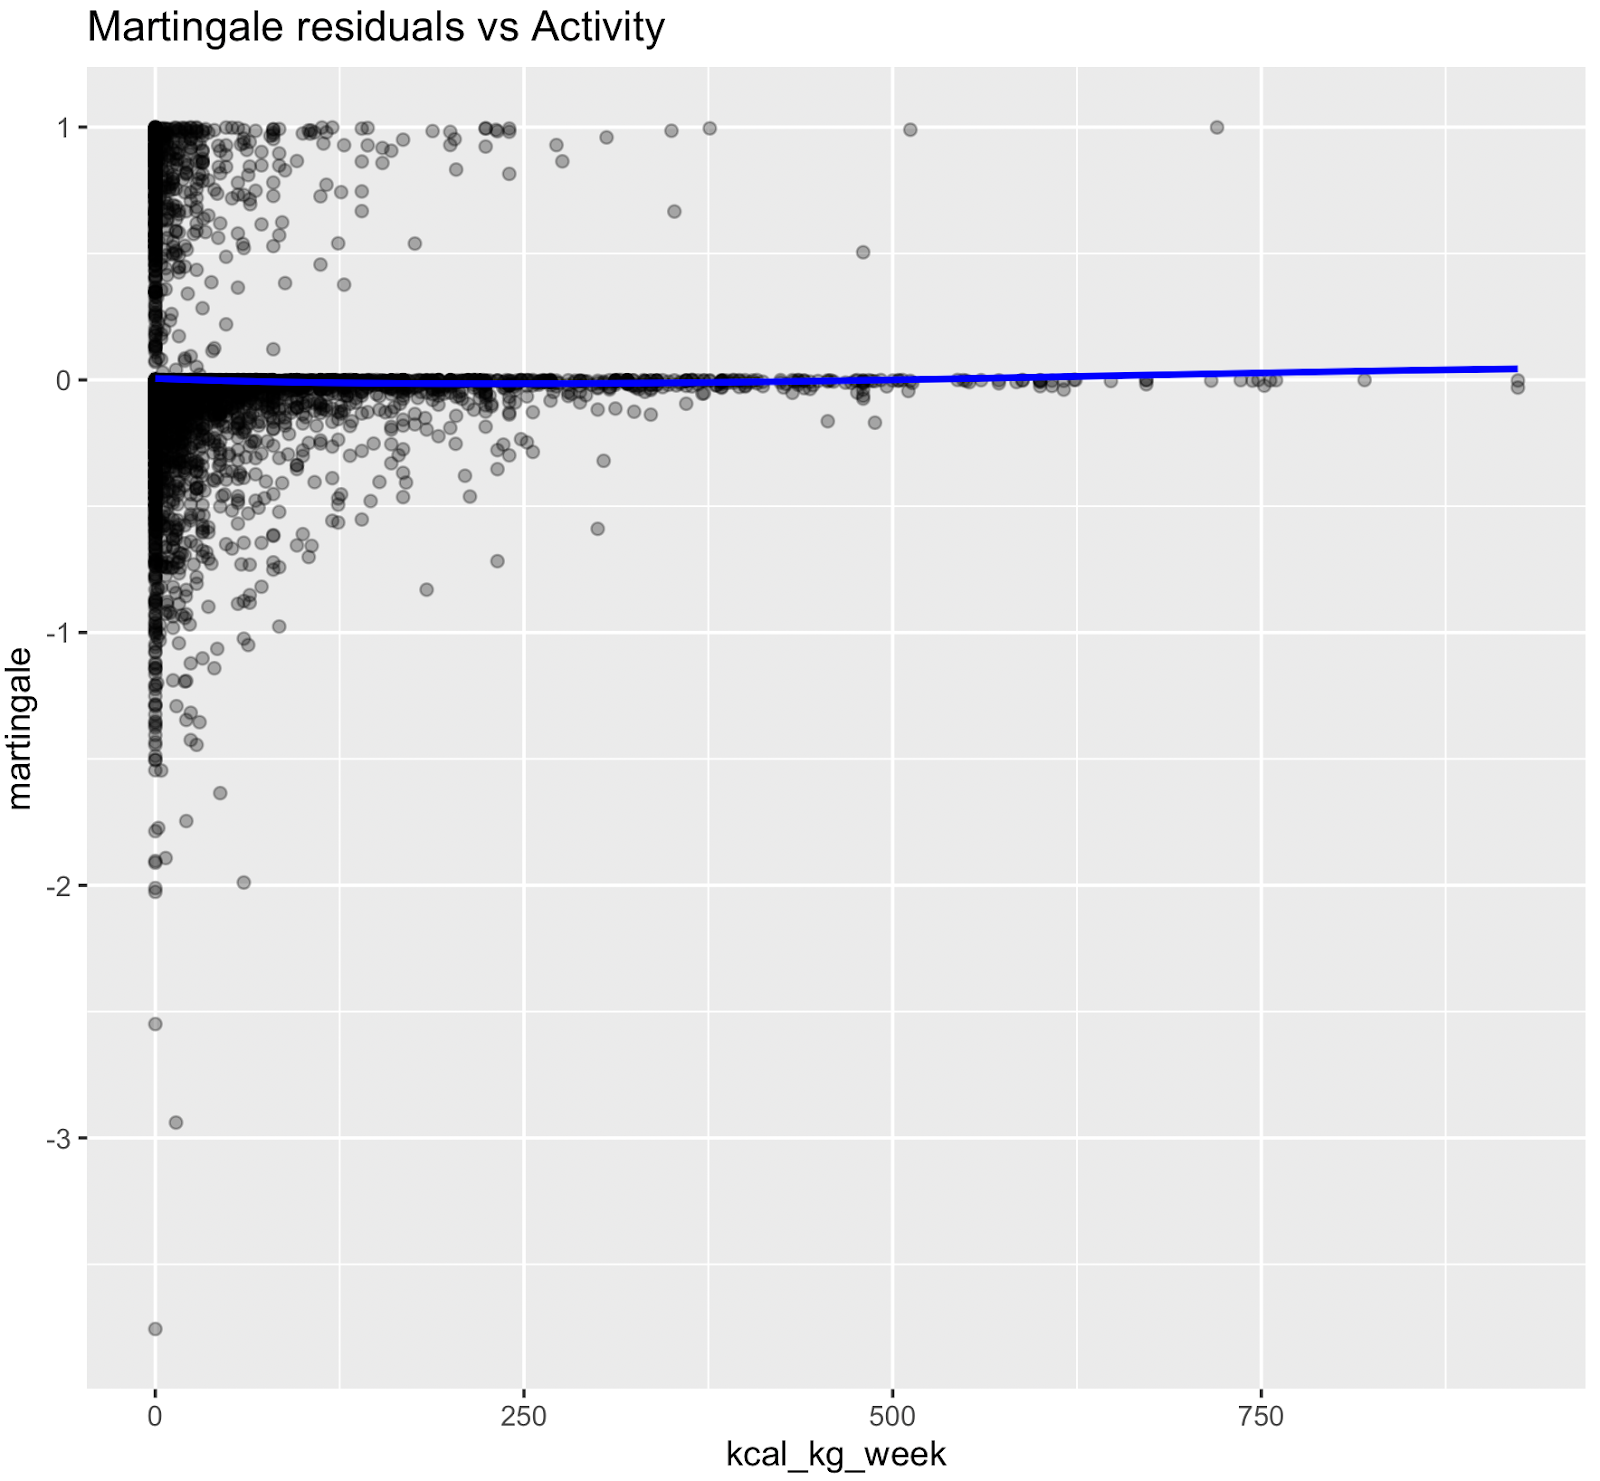
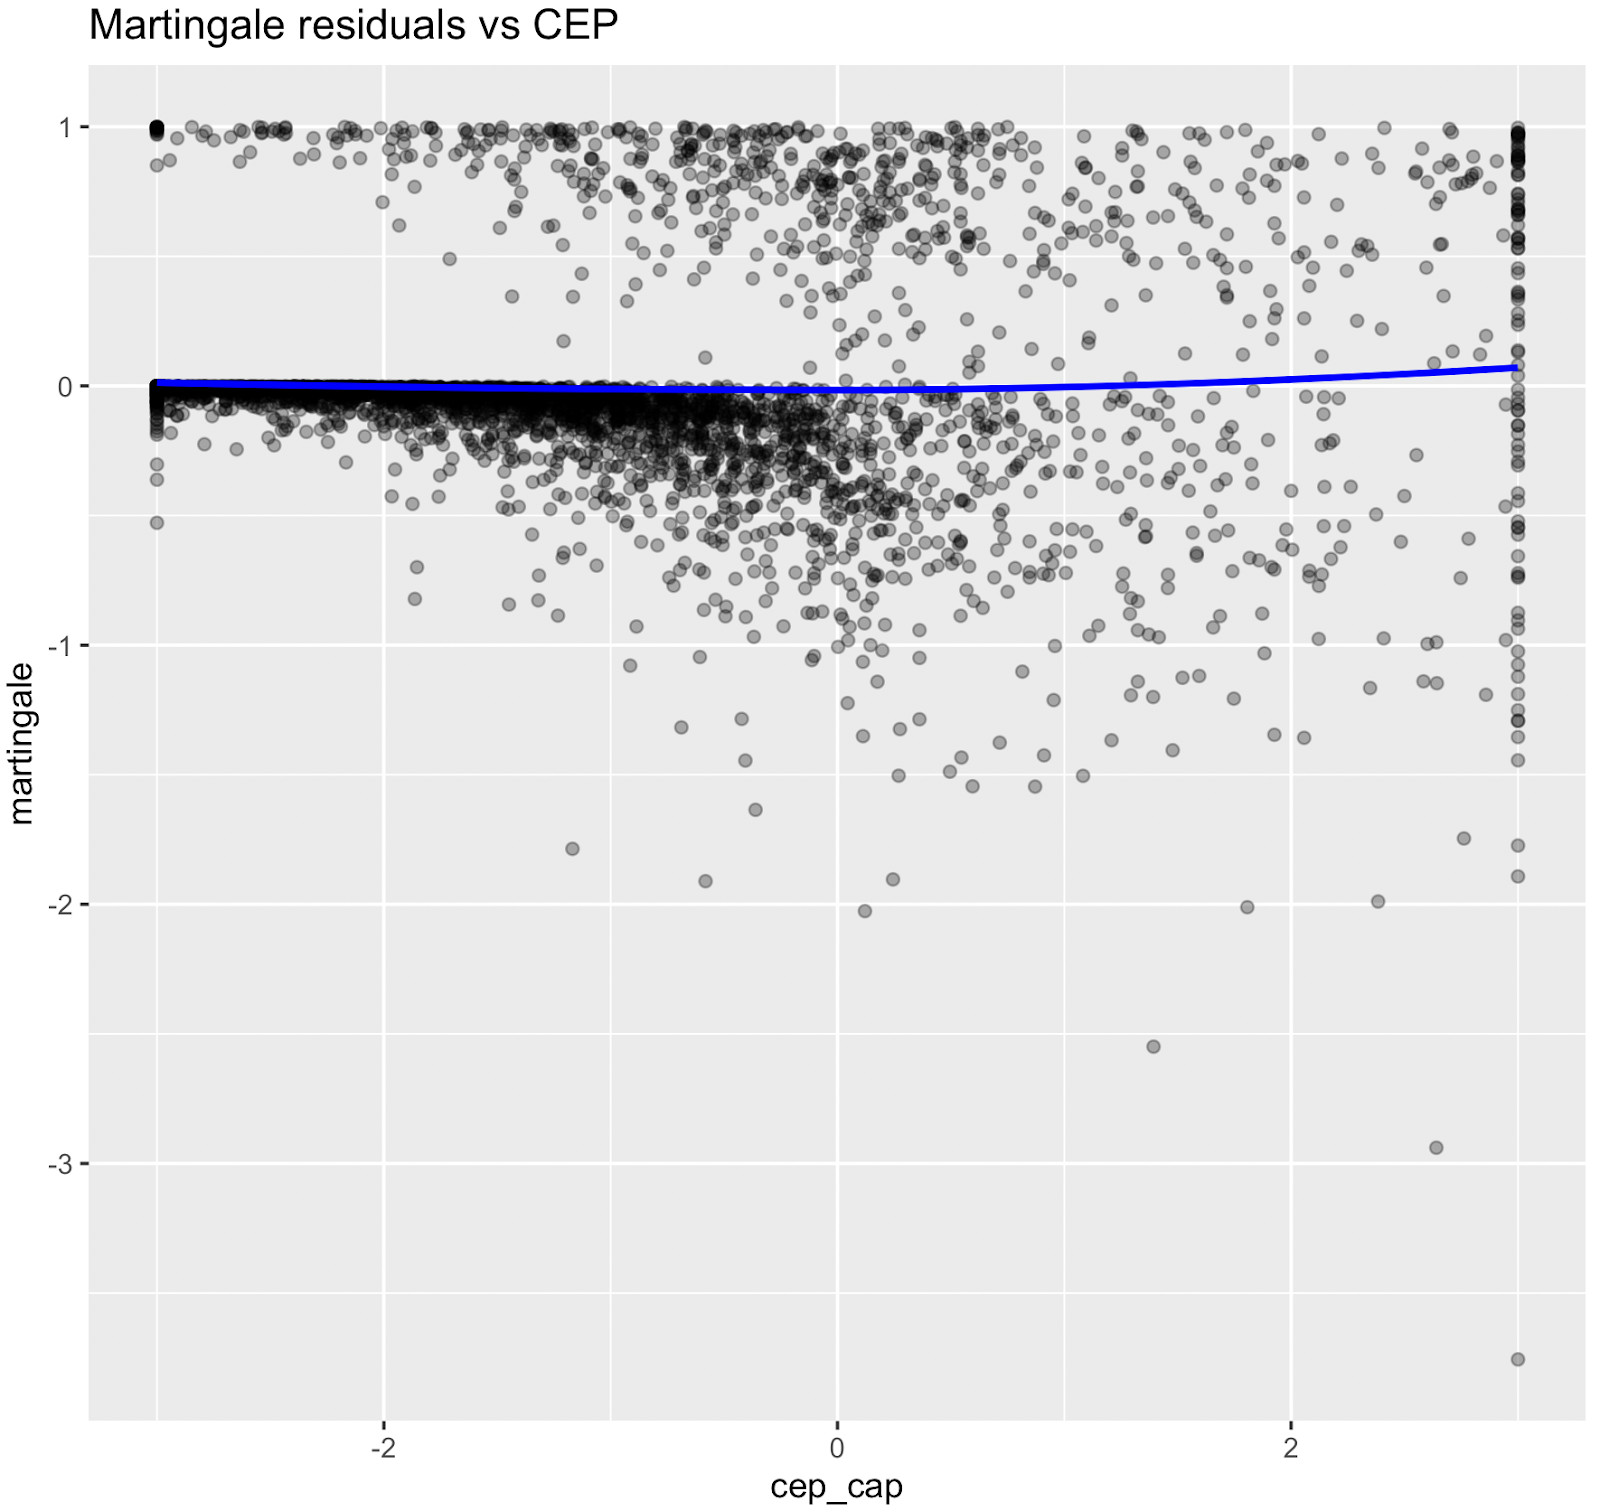
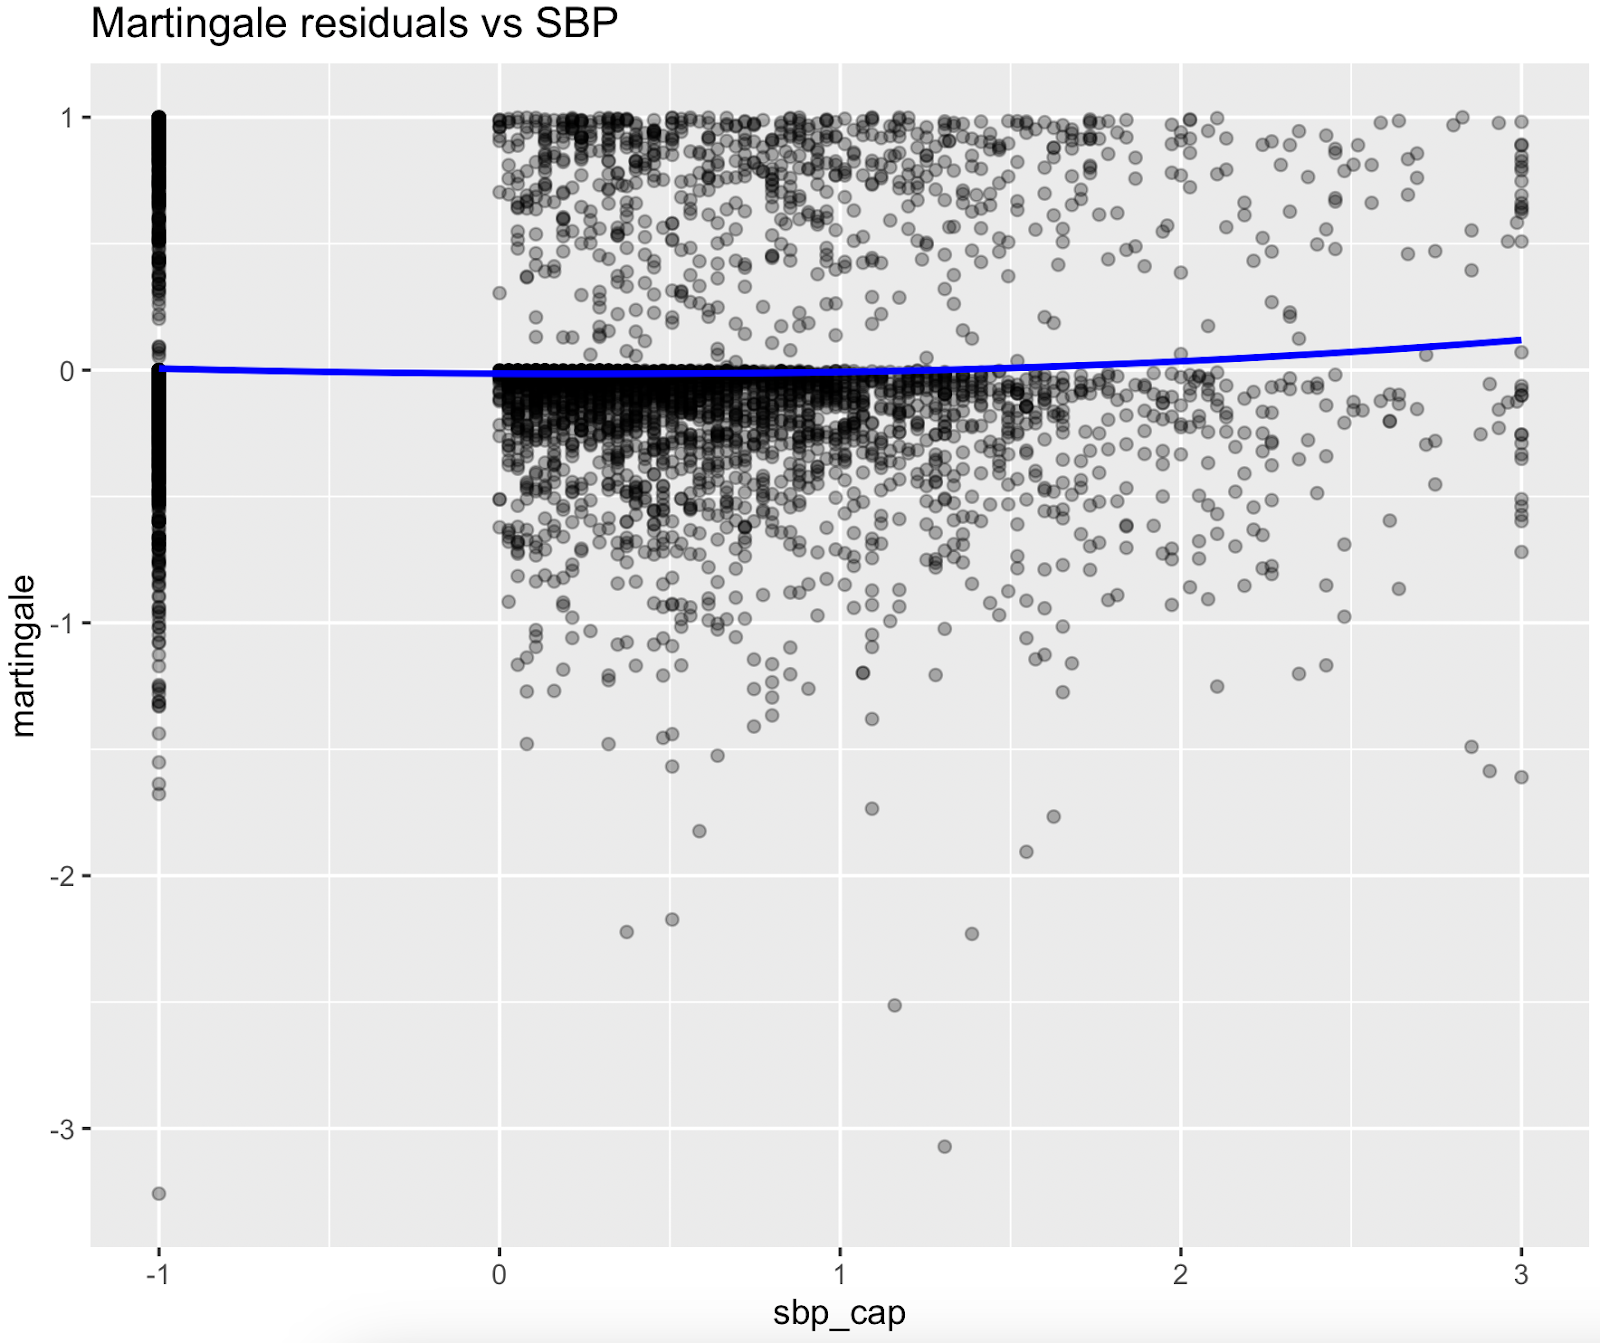
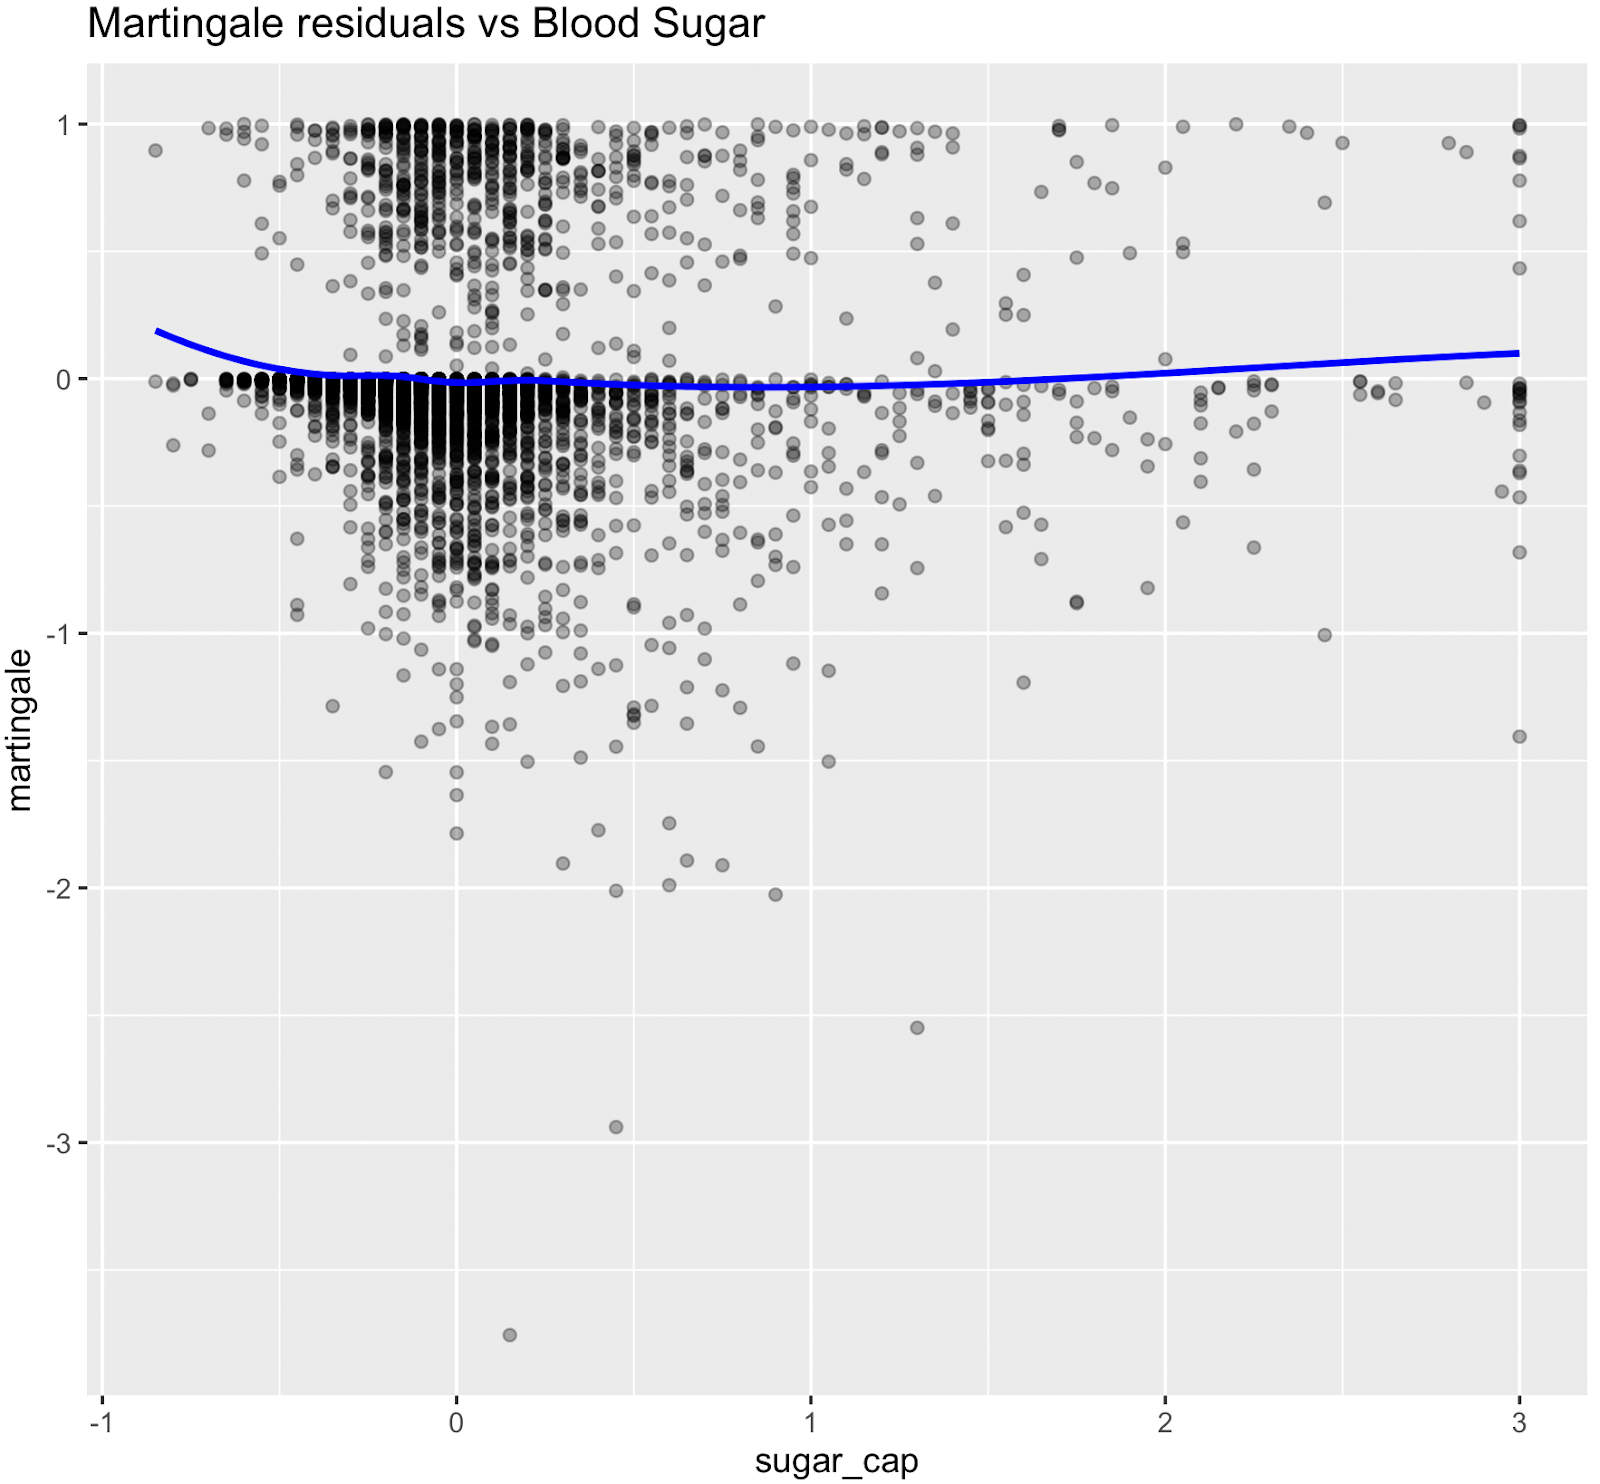
Martingale residuals indicated that linear terms were adequate for Smoking, Sleeping hours, Total metabolic expenditure, eGFR and systolic BP while blood sugar showed clear nonlinearity, supporting the use of spline functions for these variables in the final model.
Main formula
Biological Age = ChronoAge + Delta
where:
• ChronoAge: chronological age
• Delta = ∑ (βi*zi*fi) / βage
• βi: age impact of the factor i;
• zi: standardized value of factor i; clipped [−3,+3] to suppress outliers
• fi: freshness of factor i; fi∈[0,1] (1 = fully fresh, 0 = too stale)
• Delta kept within [−12,+12] years to protect credibility: if | Σ(βi * zi * fi) | > 12, recalculate with BioAge = Age + Σ(εi * zi * fi)/βage, where εi = βi * ( 12 / | Σ(βi * zi * fi) | ) ;
• Only calculated if there are at least 3 factors whose fi > 50%
Accuracy level of the Biological Age is a function of freshness factors (fi).
Accuracy = average (fi) * min ( count(fi>0) / 5, 1 )
where:
• 100% accuracy requires at least 5 fresh factors